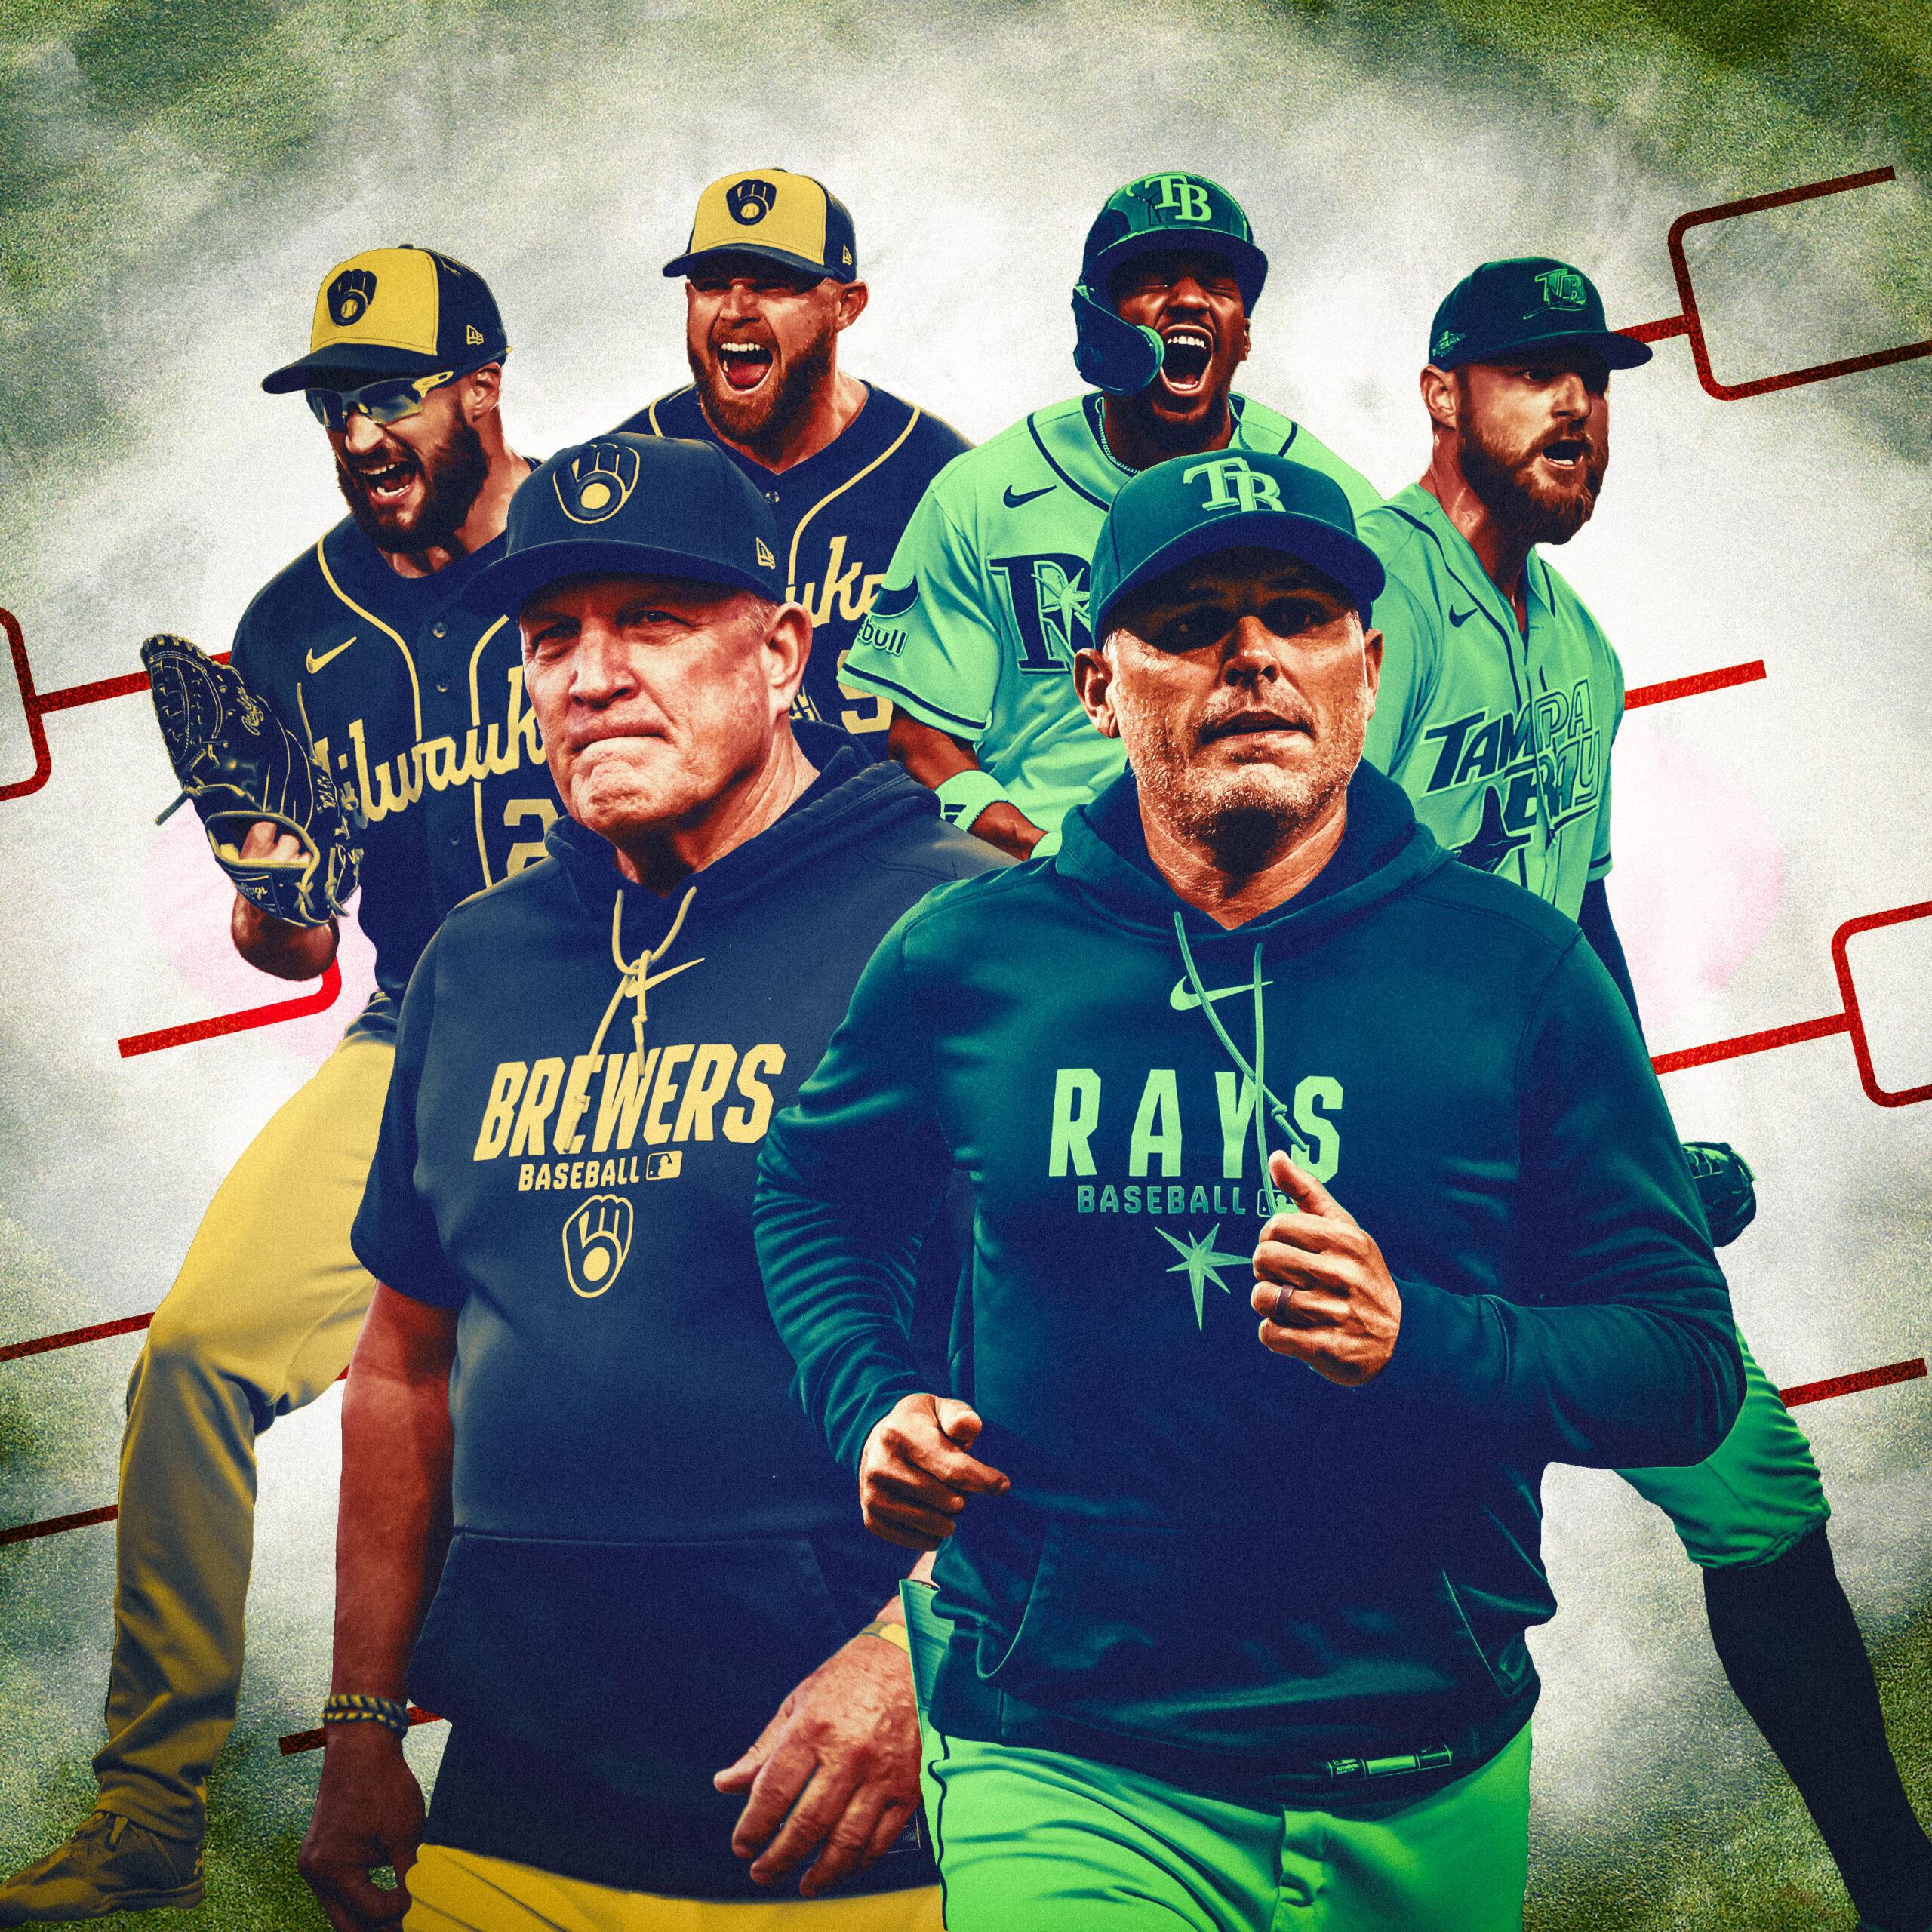

After leading a life of leisure since dispatching the Guardians and Dodgers, respectively, the Rays and Brewers will suit up and play ball on Friday, as the World Series starts in Milwaukee. The nightmare matchup for network execs and salary-cap accelerationists should offer ample pleasures for fans whose interests lie in crisp, competitive baseball, compelling characters, and delayed gratification. Unreplenished since the Rays and Diamondbacks debuted in 1998, the league’s supply of championship virgins has dwindled to five franchises, and will soon shrink to four: Famously, Rays-Brewers will be the first Fall Classic matchup since 1980 (and the second since 1920) to guarantee a first-time trophy winner.
In terms of games played, the postseason is somewhere between 91 and 95 percent complete, depending on how long the last round lasts. So as we wait for the climax, let’s take stock of five trends that have helped define these playoffs so far—and that could come into play over the final four-to-seven games. Then we’ll wrap up by pinpointing the most notable divergence between the Brewers and Rays, two Spider-Man-Pointing-meme teams.
Behold Chalktober.
’Tis the (post)season for random results, but 2026 must have missed the memo about short-series chaos. This has not been the October to trot out the Billy Beane “crapshoot” quote. Based on recent outcomes, one could almost mistake baseball for a predictable sport. These are the Palpatine playoffs, where (almost) everything is proceeding as we have foreseen.
Sure, in light of preseason projections and institutional hurdles, both the Brewers and Rays qualify as big-picture underdogs whose success stands to soak the sportsbooks (such a pity).
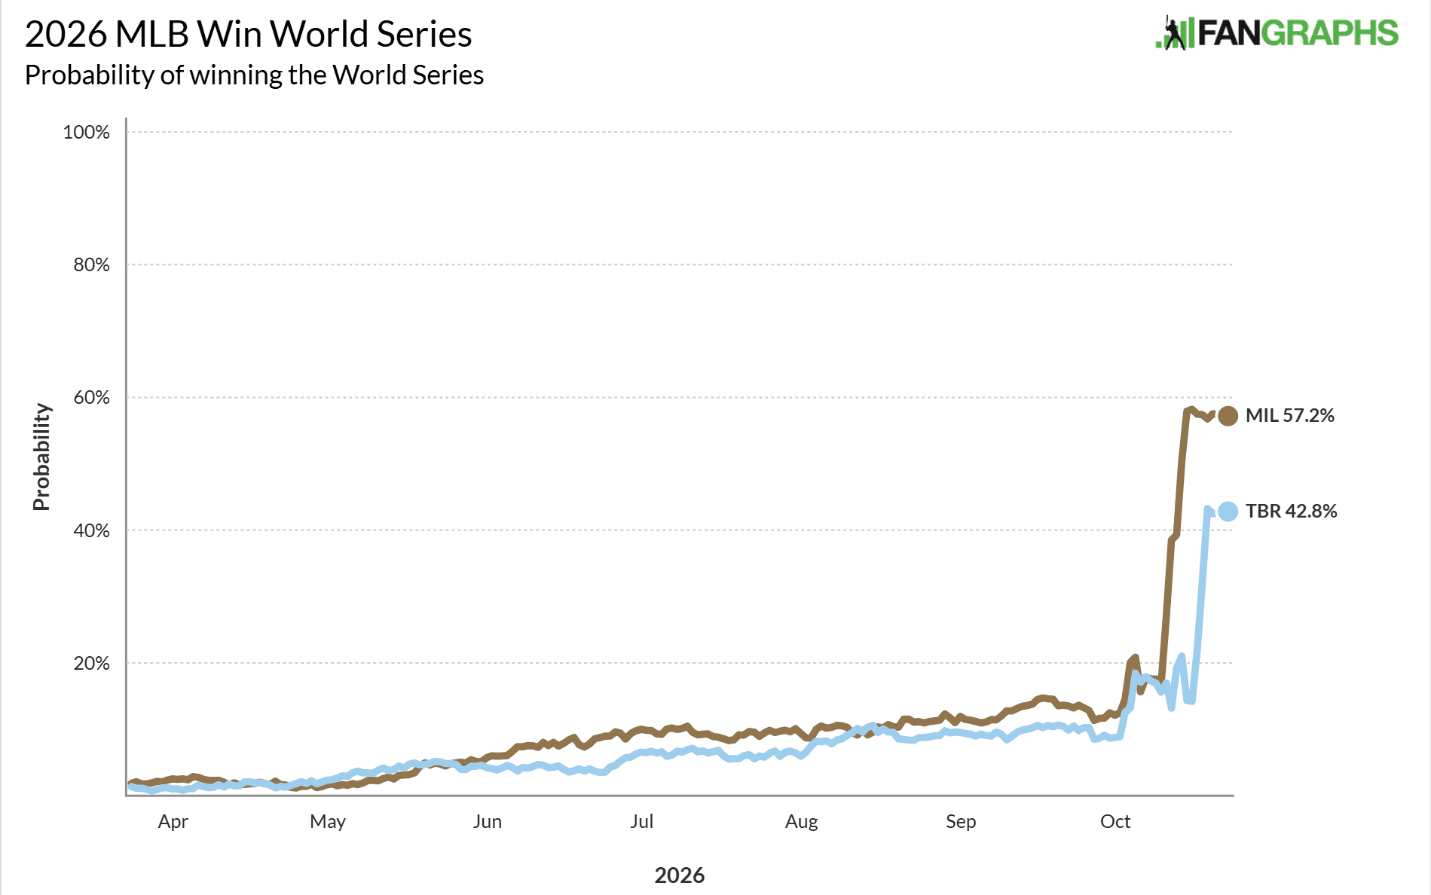
But each club led its league in wins during the regular season, so with that context, they aren’t miscast as the last two teams standing. This is the sixth time since the advent of the Division Series in 1995 that no. 1 seeds have clashed in the World Series, but that stat undersells the uniqueness of the 2026 bracket. One measly (best-of-three) series so far has gone to the lower-seeded team, and that’s only because MLB’s division-centric seeding system anointed an AL West winner with the worst full-season record of any playoff team in history (the 81-81 Astros) higher than the AL Central’s second-place, 84-win White Sox. For the first time in the wild-card era, every series prior to the World one went to the team with the superior regular-season record. If the Brewers beat the Rays, playoff teams with better regular-season records will have won wire-to-wire. And both betting/prediction markets and statistical projections give Milwaukee (which has home-field advantage) the edge.
Granted, regular-season records aren’t the only means by which to determine a favorite: The Brewers were the betting underdogs entering the NLCS, which we could dismiss as Dodgers bias if not for the fact that some objective projections saw the series the same way. Still, the potential for regular-season standouts to run the table at the tournament—in a year when truly daunting teams were few and far between—has saved us from fretting about the playoff format or lamenting the small-sample cruelty of the October baseball gods.
Or, for that matter, the relative merits of “rest” vs. “rust,” a debate that raged in the topsy-turvy 2022 and 2023 playoffs, when five of the eight teams that earned a first-round bye were forced to say goodbye in the division series. Could the drawbacks of sitting on the sidelines really outweigh the benefits of taking it easy while one’s upcoming opponent fought for playoff life? The idea seemed dubious even then, and in the larger sample since, order has been restored, and “rest” has had its revenge. After this year’s bye teams went 4-for-4 in the Division Series to wipe out the wild cards, teams that skip straight to the DS (which tend to be better teams to begin with) are now 13-7 overall in the 12-team-playoffs era. And, per Joe Sheehan, teams that have entered any playoff series with at least four days of rest, and more rest than their opponents—the spot the Brewers find themselves in now—have improved their collective record to 17-8. The defense of “rest,” well, rests.
The downside of seeing all these series swing toward the (arguably) better teams in 2026 has been a deficit of suspense, and a lot of extra, idle days for fans and players alike. Only two of 10 series so far (the all-NL-East Braves-Phillies wild-card showdown and the all-AL-Central White Sox–Guardians ALDS) have gone the distance, so a seven-game World Series with some winner-take-all drama would be welcome. Regardless of how long this last duel endures, this postseason will have featured by far the fewest games of any tournament since the 12-team format premiered in 2022.
How long can high-leverage relievers last?
Speaking of the need for rest: A lot of hurlers have gone from throwing gas to getting gassed (or Gasser) this month. It’s easy to see why. Not only are we in the late stages of a long season, but pitchers are being asked to shoulder tasks in October that they weren’t conditioned to take on for the first six months of the campaign. It’s a high-reward, high-risk strategy that looks brilliant when it works and rash when it backfires.
As I observed in September, modern pitcher usage has imposed fresh pressures on staffs. Although collectively teams tally as many innings as ever, individual pitchers throw fewer, thanks to a usage pattern that prescribes more rest between starts or relief appearances, and less length in each outing. In the playoffs, though, a combination of higher stakes and added off days encourages teams to call on top pitchers more often. The heaviest loads fall on late-inning relievers, some of whom are asked to enter earlier and stay in longer than they’re accustomed to, at a time of year when each pitch carries extra stress and strain.
To quantify the increased relative demands on relief monsters in an era of rampant openers, bullpen games and quick hooks for starters, I identified the two highest-leverage qualified (min. .3 IP per team game) regular-season relievers on each playoff-bound team going back to 1974, when FanGraphs’ Leverage Index data begins. I used “gmLI,” which represents the average game state when the pitcher was called upon, and I focused only on the periods after each All-Star break, because bullpen hierarchies are cemented down the stretch. Then I compared those trusted arms’ regular-season and postseason usage rates, excluding any cases in which an established relief ace didn’t pitch in the playoffs (typically due to injury, give or take the odd Zack Britton blip).
For example, this playoff field’s dozen no. 1 late-season leverage relievers—Bryan Baker, Trevor Megill, Cade Smith, Mason Miller, Tanner Scott, Grant Taylor, Didier Fuentes, et al.—accounted for 4.6 percent and 4.8 percent of their teams’ regular-season batters faced and innings, respectively, after the All-Star break. In the playoffs, they’ve upped those proportions to 8.9 percent and 9.4 percent, each of which is the highest annual figure for relief aces since 2004. And because regular-season usage is lighter than it used to be, this postseason ramp-up is especially pronounced by comparison. This year’s stoppers’ ratio of postseason-innings percentage to regular-season-innings percentage—1.96—is the highest in the whole 52-season sample.
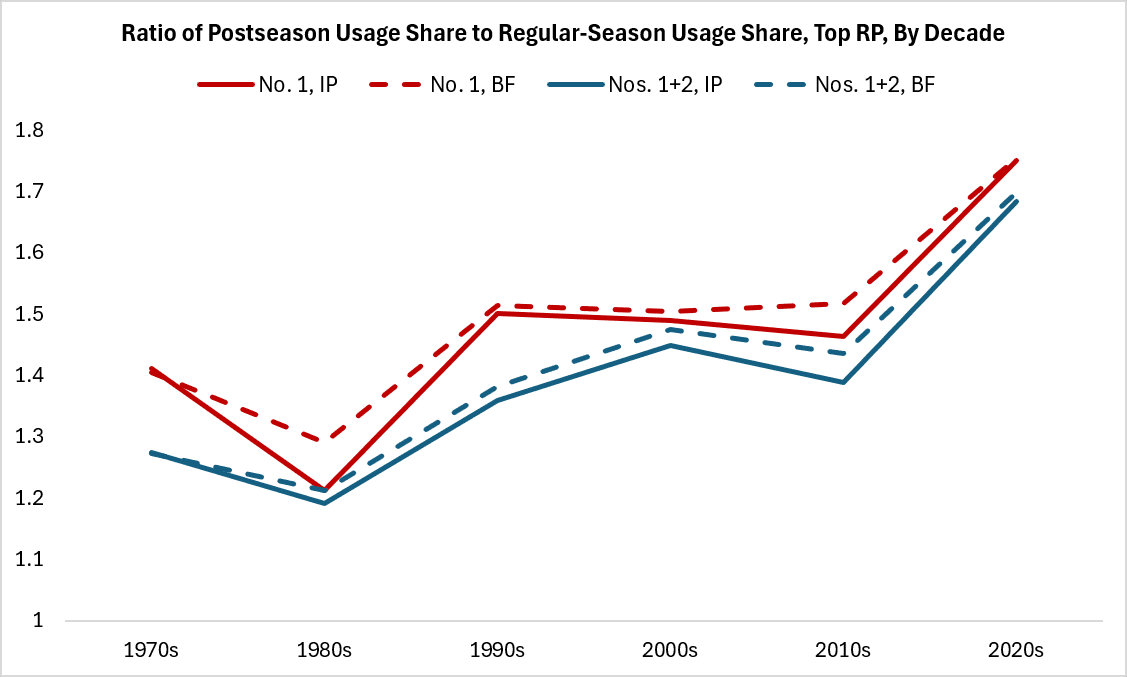
The chart below aggregates these usage rates by decade. The red lines—solid for innings, dotted for batters faced—reflect the ratios for no. 1 relievers; the blue lines also include the second-ranked sidekicks (such as rubber-armed Brewers lefty Aaron Ashby). In the ’70s and ’80s, firemen pitched so prolifically during the regular season, and starters stayed in games so long, that the typical playoff bullpen boost was modest. The rates rose in the ’90s, 2000s, and 2010s, buoyed by outliers such as October iron man Mariano Rivera, the reliever-reliant 2011 Cardinals, and the 2016-17 Cleveland clubs of Cody Allen and Andrew Miller. But the 2020s uptick is apparent.
When this works, it’s a marvel: Think White Sox closer Taylor going 2 1/3 innings in Game 1 of the wild-card series against the Astros, or 4 innings in ALDS Game 1 against the Guardians; Braves setup man Fuentes lasting 3 2/3 in Atlanta’s NLDS Game 2 victory over L.A.; Padres FIP phenom Miller getting five outs (all via Ks) vs. the Cubs in wild-card Game 2; Cleveland closer Smith pitching in nine of 11 Guardians postseason games; Ashby actually leading Milwaukee in postseason innings pitched; or Baker, Tampa Bay’s automatic closer, pitching in every Rays win thus far.
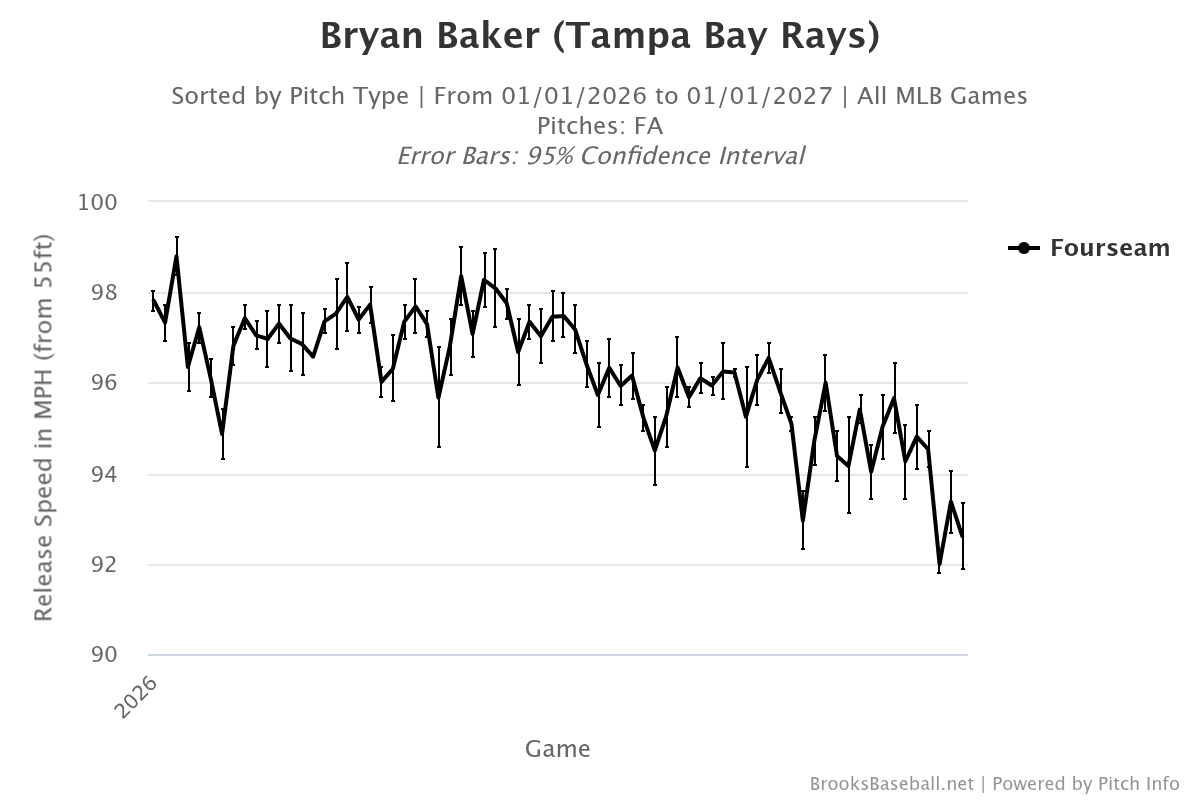
But sometimes the postseason pixie dust wears off. Remember when Taylor faced six batters without recording an out in ALDS Game 4? Or when Miller faltered in his second inning of work in NLDS Game 2, blew a save, and took the loss, which prompted Padres skipper Craig Stammen to say that Miller was still learning how to maintain his adrenaline level after an inning break, and that the closer could be limited to single frames from then on? Or when Phillies closer Jhoan Duran surrendered a crushing three-run blast to the Braves’ Austin Riley in Duran’s second inning of wild-card Game 1? Or when Smith was replaced by Gavin Williams after a rocky start to his second inning of work in ALDS Game 4, or coughed up a homer without his best stuff in ALCS Game 6? What about Baker’s semi-concerning velocity loss of late?
The impulse behind this postseason pitching pattern is sound: Teams should want to hand important assignments to important pitchers. But the process is suspect. Teams can’t necessarily push pitchers like this with impunity when their arms haven’t been prepared for regular multi-inning outings, they’re facing the same opponents repeatedly in the same series, and they’re being scouted and tested more strenuously than at any other time of year. Under these conditions, a great reliever may look like his usual dominant, probably bearded self when he’s warming up, but the results are liable to leave a lot to be desired.
Challenging is changing.
In close playoff games, every call counts, and players have adapted accordingly. Teams probably didn’t challenge enough in the inaugural year of the ABS system, but they wised up somewhat as the season went on, both by challenging more often and by reserving more of their challenges for catchers, who head-tap more judiciously than either hitters or (particularly) pitchers. Both trends have intensified in the playoffs, as evidenced by the chart below, which shows the average number of challenges per team game over time, broken down by position.
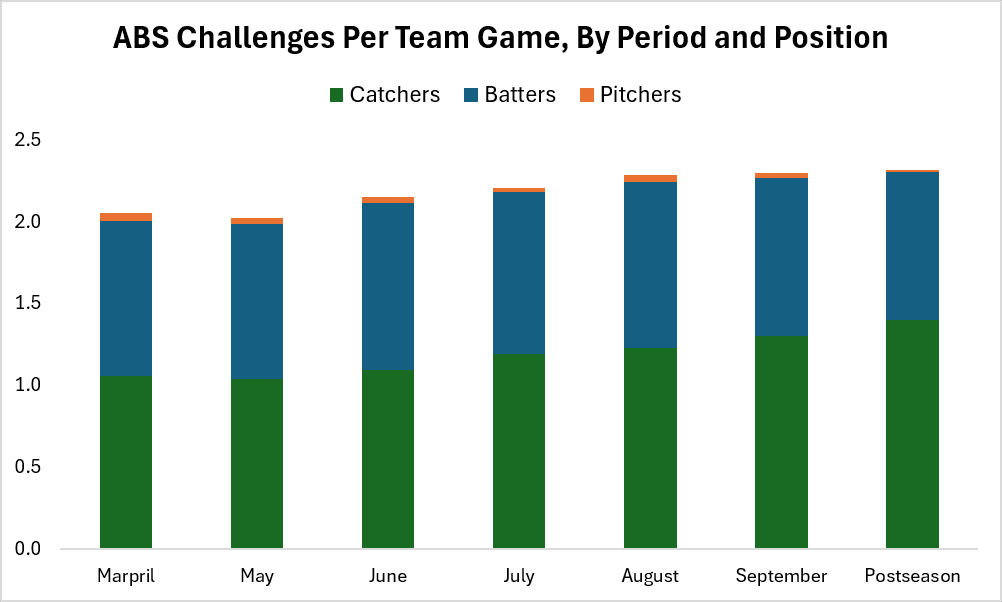
In March/April (Marpril?) and May, teams were averaging just a tad over two challenges per game. Lately, they’ve settled in around 2.3. And catchers have accounted for an increasing percentage of those instances.
Percentage of All Challenges Issued by Catchers
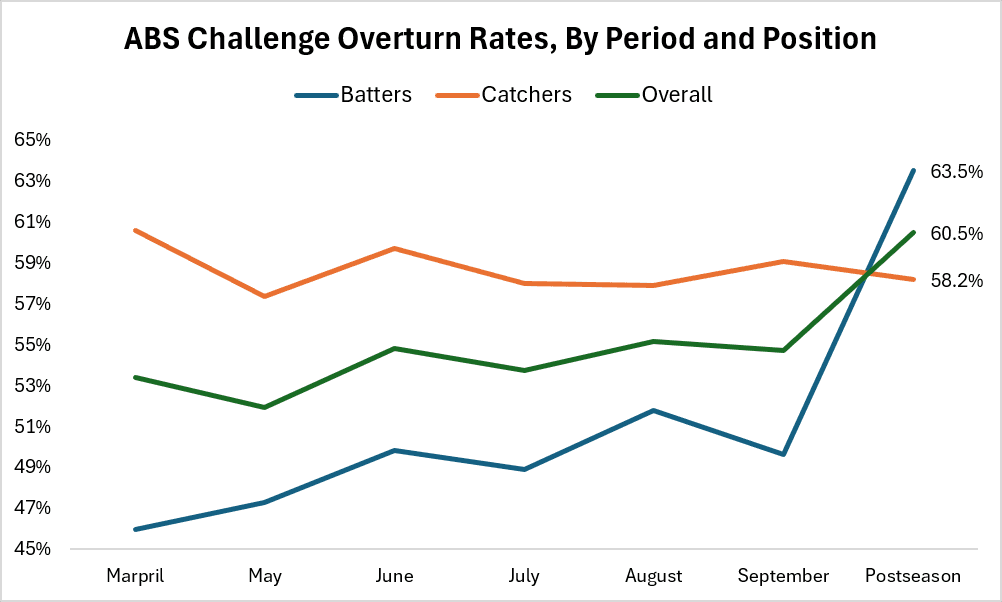
Despite challenging more often, catchers have essentially maintained their overturn rate. Meanwhile, hitters have upped their success rates significantly in the postseason as they pick their spots more selectively, whether by choice—following the lead of the Rays’ Bartleby-esque slugger Yandy Díaz, who prefers not to challenge and has yet to test the technology—or because they’ve been told to. The overall playoff success rate has topped 60 percent, which is especially impressive given that postseason umpires tend to be better ball-strike callers (in theory, at least).
In some respects, the playoffs provide a sneak preview of what regular-season baseball is about to look like, so expect more challenges, especially by backstops, next year. The implementation of ABS effectively shrank the strike zone, which helped hitters a bit. But the challenges themselves are morphing into a defense-oriented tool.
No one can score.
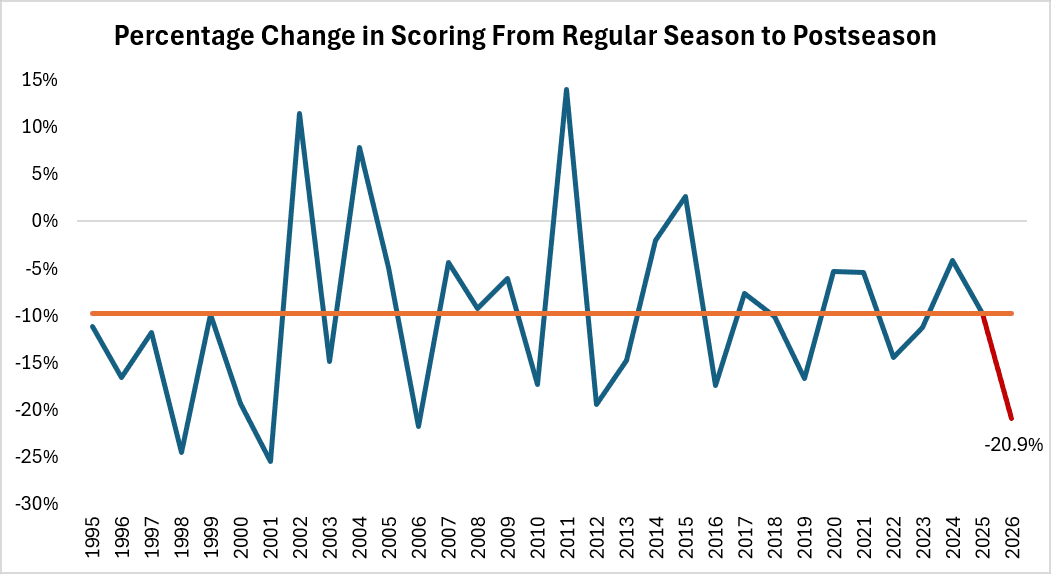
Runs are typically at a premium in the playoffs, when the weather is cold, hitters face imposing pitchers and fielders, and teams pull out all the stops to suppress scoring. But this year’s postseason scoring has been especially scarce.
Entering this year, the average dropoff in runs per game from the regular season to the postseason during the wild-card era (since 1995) was 9.8 percent. So far this postseason, scoring has cratered by more than twice that (20.9 percent), from an already lackluster 4.48 runs per game during the regular season to a deadball era-esque 3.54 in the playoffs. That’s the biggest decline in 20 years (and there were fewer games back then).
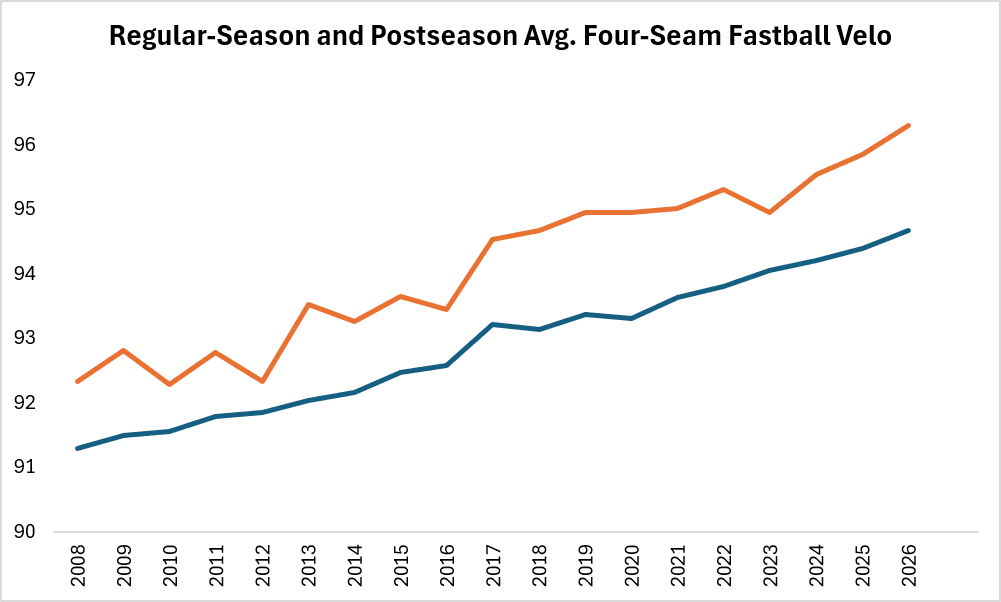
This was foreseeable, to some extent, considering that the lineups of these playoff teams were a mediocre bunch. Most of baseball’s best pitchers played for postseason teams; roughly half of its best hitters didn’t, and some of those who did were unavailable (Aaron Judge), nursing or recovering from injuries (Shohei Ohtani, Willson Contreras), or not long for the tournament (Yordan Alvarez). The healthy hitters have had it hard (literally), as the average speed of a four-seam fastball—always firmer in the playoffs—has climbed by a greater degree relative to the regular season than in any year on record excluding 2020. For the first time, postseason pitchers’ four-seamers are sitting 96.
Throw in the defense-first challenging, some evidence for a less lively ball, and positionless pitching staffs fronted by ever-present playoff powerhouse “TBD”—pitcher’s duels are now pitchers’ duels—and we have all the ingredients for meager run totals and tight margins. In late September, Sheehan wrote, “I’m anticipating a very low-scoring postseason. The lower the run environment, the better the chance for upsets.” The upset potential hasn’t panned out, but the abstemious scoring certainly has. All the more reason to play postseason small ball.
We’ve seen lefties galore.
Although the offensive outage has afflicted hitters of both handedness, lefties (.227/.308/.351, .294 wOBA) have fared a bit better than righties (.208/.289/.332, .278 wOBA) so far. That’s not unusual: Lefties have the platoon advantage more often, so they often outhit righties as a group. What is unusual—unprecedented, even—is that this year’s lefties have hit so much more than righties. As in, left-handed hitters have made more trips to the plate (1218) in the postseason than right-handers have (1044).
Even though postseasons used to consist of much smaller samples, which were subject to sharp fluctuations from year to year, lefty plate appearances haven’t outnumbered righty plate appearances in any postseason since before Pearl Harbor. In the 1941 World Series, Yankees/Dodgers lefties batted 12 more times than their northpaw counterparts. After that, righties reigned supreme for 85 years—until now, when the ratio of righty PA to lefty PA has fallen to its lowest level in any year since the first modern World Series.
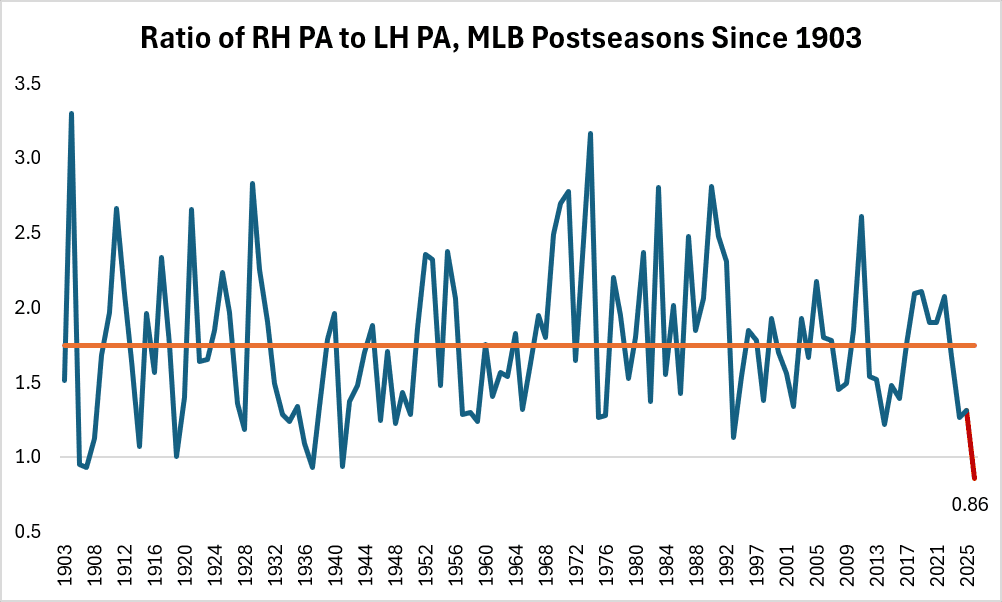
Although this is an outlier, it actually tracks with what we saw all season. For a number of reasons—more breaking-ball-centric pitch usage, the elimination of infield overshifts, an ABS-driven reshaping of the strike zone, improvements by left-handed pitchers against right-handed hitters in 2025—2026 was the year of the left-handed hitter in MLB. Lefties didn’t outnumber righties during the regular season. But lefties did raise their own record high for plate appearances in a single season by more than 10,000. In the playoffs, that list to the left has grown even stronger.
The Rays and Brewers haven’t bucked this trend: Both teams have deployed lefty hitters more often than righties this month. And both teams have hit well against southpaw pitching in the playoffs, even though that was a relative weakness for them prior to October. Huh, these two teams just might have a few qualities in common. Speaking of which …
Do the Brewers and Rays do anything differently?
This season’s pennant winners are a little like Guardians manager Stephen Vogt and bench coach Tony Arnerich: They don’t look exactly alike, but you’ll definitely do a double take the first time you see them side by side. The list of attributes these two teams share runs a lot longer than the list of traits that set them apart.
Both teams are small-market and low-payroll, although the Brewers spend meaningfully more than the Rays and Tampa–St. Petersburg’s “market score” mogs Milwaukee’s. Unlike the largely homegrown Guardians, the Rays and Brewers were built by trades. They (not unjustifiably) bunt for hits and go the other way more often than anyone else. They sacrifice, hit grounders, beat out infield hits, make productive outs, and, more importantly, don’t make many outs, period. They play good defense, steal bases, and sprint speedily. The Brewers hit the ball harder, but neither launches a lot of homers—or, at least, they didn’t until Milwaukee cranked 10 in seven postseason games, a 231-dinger pace over 162 games (which would have led the majors). Oh, and that bit about how teams are issuing ABS challenges more often in the playoffs than they did during the regular season, but are also concentrating those challenges among catchers? The Rays and Brewers have embodied both shifts. They challenge, and refrain from challenging, in similar fashion.
Both clubs employ oodles of scouts and statheads. And you’ll never guess how many times these teams have traded with each other lately. The Brewers’ most frequent trade partner in the past five years? The Rays. The Rays’? Um … the Mariners, Mets (whose POBO is a former Brewer), and Marlins (who hired their POBO away from the Rays). But after them, the Brewers! (In a four-way tie with the Phillies, White Sox, and Dodgers, but never mind that.) The Rays’ top two starters (Drew Rasmussen and ALCS MVP Freddy Peralta) made their big league debuts as Brewers. The Brewers’ best hitter (NLCS MVP Jake Bauers) debuted as a Ray. It’s downright incestuous. The Brewers’ baseball operations are run by a former Rays exec, but heck, whose aren’t? Did I mention that both teams’ position players are mostly small? (With some striking exceptions.)
So, let’s play “spot the difference,” if we dare. The Rays play in a dome, whereas the Brewers play in a ballpark with a retractable (and friendly) roof. But wait: That roof will likely be closed during what’s shaping up to be the first all-indoor World Series. Not so different after all; back to the drawing board. During the regular season, the Brewers rostered the youngest collection of pitchers, and the Rays assembled the second-oldest. Is that anything? Eh. Brewers pitchers led the majors in fastball rate; Rays pitchers led in off-speed percentage. Warmer! OK, how about this: The Brewers have been better at controlling the opposition’s running game. Now we’re getting somewhere. That might matter!
But there may be a more defining difference. The Brewers and Rays had the same full-season batting averages (.258), and their Isolated Power figures were one point apart. But their plate-approach stats were almost diametric opposites. The table below shows their MLB ranks in various categories, ordered by frequency. (That is, a team whose hitters chase the least would rank 30th in that category, even though in that case, “last” could be construed as “best.”)
Brewers and Rays Plate Approaches, MLB Ranks
No team strikes out less than the Rays. No team walks more or swings or chases less than the Brewers. Meanwhile, the Rays aren’t especially patient, and the Brewers aren’t particularly inclined toward contact. Put it all together, and the Brewers see the most pitches per plate appearance, whereas the Rays see the second-fewest (ahead of only the Rockies). No wonder the Rays play the fastest games in the majors, on average, and the Brewers play the seventh-slowest. In short, Milwaukee grinds out plate appearances and makes pitchers earn every swing. The Rays are less selective. That disparity should favor Milwaukee, because Tampa Bay’s bullpen is a bit more vulnerable, and the Brewers should gain more from inflating pitch counts and driving starting pitchers out of the games.
Except … well, let’s look at a corresponding table for each team’s pitchers.
Brewers and Rays Pitching Approaches, MLB Ranks
The Brewers see the most pitches per trip to the plate, but Rays pitchers throw the fewest pitches per inning, and close to the fewest per batter faced. Brewers batters draw the most walks; Rays pitchers allow the least. Then again, Rays pitchers aren’t so stingy because they pound the zone more often than Brewers moundsmen do; they excel at getting hitters to swing and chase, which Brewers batters don’t do. On top of all that, Brewers pitchers lead the league in strikeouts, which Rays hitters lead the league in resisting. And round and round we go.
Maybe these respective walk/strikeout strengths on opposite sides of the ball cancel each other out. Each action elicits an equal and opposite reaction; unstoppable object, meet immovable force. But between today and Halloween, something’s gotta give. Either the Rays or the Brewers will blink, and that’ll be the ballgame—and, sadly for seamheads, the season.