Tampa Bay Ray Ryan Yarbrough had a strong rookie season in 2018, throwing 147 1/3 innings, recording an ERA well below the league average, and finishing fifth in AL Rookie of the Year voting. He also had a strange rookie season, making only six starts—the fewest for a pitcher with as many innings pitched since 1986. Yarbrough was a “bulk guy,” a term he helped coin. When the Rays used an opener, Yarbrough was often the arm tasked with taking the ball second and delivering a lead to the late-inning relievers. In 20 of his 32 appearances out of the pen, Yarbrough entered in the third inning or earlier, and in 18 of 32, he lasted at least four innings.

In the first year of the opener, multiple writers, as well as Diamondbacks starter Zack Greinke, suggested that the strategy might save teams money by transferring innings from well-compensated starters to interchangeable relievers. That may not be true on a long-term or across-the-board basis: If teams value openers and bulk guys, they’ll probably pay more to employ them on an inning-per-inning basis. But in the short term, it could cost some individual pitchers, particularly those in their arbitration years, whose salaries depend on a process that relies largely on comparisons to past players and—because arbitrators tend not to be well-versed in sabermetric measures—typically depends on basic statistical benchmarks like games started. Yarbrough won’t be eligible for arbitration until after 2020, but he’s already felt the financial effects of his unorthodox stat line.
“It has come to the fore actually quicker than we thought,” says Yarbrough’s agent, Jim Munsey.
Like a lot of players, Yarbrough is sponsored by an equipment company that supplies some of the tools of his trade and pays him end-of-year bonuses based on playing time. One of those sponsors offers modest payouts per start. Because Yarbrough made only six starts, he stood to lose thousands of dollars compared with pitchers logging similar innings totals, which wasn’t insignificant for a first-year player making the major league minimum.
Munsey appealed to the sponsor with some simple math. There were 10 pitchers within five innings in either direction of Yarbrough’s workload last year—five above and five below. Those pitchers averaged 26.6 starts. Munsey made the case that 26 was the more fitting figure for Yarbrough, and he persuaded the sponsor to pay his client based on his innings total instead of his starts.
It’s easy to see how a valuation system based on elementary counting stats such as starts or innings could be skewed by a bulk guy or opener. One would think, though, that one of the most mainstream and comprehensive sabermetric stats, wins above replacement, would apportion credit in a more enlightened way. Yet even WAR wasn’t up to the task of giving Yarbrough his due. As DRaysBay blogger Joshua Morgan noted late last season, Yarbrough broke WAR because the metric classified him as a reliever. Relievers outperform starters on a rate basis, so they have a higher replacement level, which led to a lower WAR for the bulkiest of the bulk guys. Just like the equipment company, WAR was penalizing Yarbrough by treating him more like a reliever than a starter.
In one flavor of WAR, that wrong was recently righted, and Yarbrough is belatedly being rewarded for doing a more difficult job. That change in a statistic, prompted by a change in team tactics, reflects the increasing prominence of the opener as that no-longer-novel approach to pitcher usage enters its second season. It also emblematizes the ever-evolving nature of WAR, a statistic whose accuracy stems in part from a fascinating, frustrating, and ultimately admirable quality: Unlike most traditional stats, WAR is willing to change its mind.
Last spring, when the opener appeared, the stewards of WAR—most notably Baseball-Reference, FanGraphs, and Baseball Prospectus, each of which publishes its own version of WAR (or in BP’s case, WARP)—adopted a wait-and-see stance, taking no immediate action but reserving the right to tinker if the strategy spread. It didn’t take long for that to happen. In the second half of last season, several teams imitated Tampa Bay’s opener scheme, and many more have indicated a willingness or intention to use it in 2019. That made it more imperative for the sabermetric community to propose a statistical solution.
Sabermetrician Tom Tango, who co-authored The Book, helped implement and popularize the current WAR framework, and now serves as the senior database architect of stats for MLB Advanced Media, raised the issue of adjusting WAR for the opener in a post on his site last June. Within the ensuing discussion thread, Tango proposed a way to identify openers and bulk guys, the latter of whom he called “headliners,” a label proposed by MLBAM intern Tess Kolp.
Under Tango’s definition, an opener candidate would be any pitcher who appeared first in a game and recorded at most six outs or faced at most nine batters. A headliner candidate would be any pitcher who was the first reliever to enter the game (or the second, if the first one entered mid-inning and the second started the next inning) and recorded at least 12 outs or faced at least 18 batters. If a game had both an opener and a headliner—they would have to go together—then for statistical purposes, the opener would be treated as a reliever and the headliner would be treated as a starter, debiting the former and crediting the latter with 0.01 wins per inning.
Last week, Baseball-Reference implemented precisely that solution. The biggest beneficiary was Yarbrough, who went from 0.91 WAR to 1.53 WAR, a gain of more than six-tenths of a win. The biggest loser was Rays righty Ryne Stanek, who started 29 times, although because he pitched fewer innings than Yarbrough, he was docked only 0.15 WAR. Munsey, who wasn’t aware that Baseball-Reference was planning to alter its formula in a way that would burnish his client’s statistical résumé, says, “Now that you’ve told me this about the change, I’m very happy.”
Our focus should be on representing the truth as best we can estimate it. And it’s the truth that will attract the people.Sabermetrician Tom Tango
This statistical fix for the opener isn’t necessarily set in stone. Sabermetrician Sean Smith, who operates BaseballProjection.com, consults for a major league team, and computed the original Baseball-Reference WAR framework that the site used until May 2012, has proposed a possibly superior but more complex solution: a sliding scale. This method wouldn’t draw a binary distinction between starters and relievers based on surpassing or failing to reach a number of outs recorded or batters faced in an outing. Rather, it would impose progressively lighter penalties on pitchers for each additional batter they face within games, an elegant idea in an era when the lines between starters and relievers are blurring by the season.
Tango supports the sliding scale as a long-term alternative, but putting it in place would be a bigger project. “The sliding scale approach is intriguing but would be a more fundamental change and would require a lot of testing before we push it out,” says Kenny Jackelen, a software developer for Baseball-Reference proprietor Sports-Reference.
The other sabermetric standard bearers have yet to make an opener adjustment, and, as a result, Yarbrough’s WAR at FanGraphs remains 0.9. “I think we’ll definitely do something here, but probably still need to think about exactly what we want to do,” says FanGraphs founder David Appelman, who favors the sliding-scale suggestion. Baseball Prospectus director of research and development Harry Pavlidis acknowledges, “I think we’ll eventually want to make some changes,” although Jonathan Judge, a member of the BP stats team, observes that the site’s pitching stat, deserved run average, already accounts for a pitcher’s opponents and whether he’s facing them for the first, second, or third time in the game, opining that there’s “no need to impose arbitrary penalties or sliding scales if you are already looking at things on a PA-by-PA basis.”
Even at Baseball-Reference, the present opener adjustment may not be the permanent opener adjustment, which illustrates the way in which WAR is always in flux. Yarbrough’s 2018 WAR at Baseball-Reference wasn’t 1.53 a week ago, and it won’t be 1.53 forever. That number is the site’s best estimate today of what Yarbrough was worth last season. But its best estimate just improved, and it will probably improve again.
The post that publicized Baseball-Reference’s opener adjustment also announced two other changes to WAR: a tweak to past-park factors and the addition of detailed defensive data for catchers from 1890 to 1952, which changed both catcher and pitcher WAR totals for those seasons. Catcher Duke Farrell retired 114 years ago and died in 1925, but he gained almost eight career WAR with one postmortem update. You may not be familiar with Farrell, but you’ve heard of Cy Young; the same update subtracted more than four WAR from Young’s career tally, which elevated Walter Johnson into first place among pitchers on the career WAR leaderboard.
Those adjustments spanned the three reasons WAR tends to change. First, a change in the way the sport is played inspires a corresponding tweak to the stats. That was the case with the opener adjustment, just as it was with an adjustment to pitchers’ offensive value last March that was prompted by the arrival of Shohei Ohtani. Second, the passage of time deepens our understanding of old data. Baseball-Reference’s park factors, for instance, are now calculated on a three-year rolling basis, which means that 2018 action retroactively changes the park factors for 2017—and, by extension, ensures that everyone’s prior-season WAR values will change after the fact. And third, new data sheds a brighter light on past seasons, permitting a more precise accounting of contributions that were once murky. As Retrosheet continues to dredge up details about earlier years, WAR gets more granular.
Unlike BP and FanGraphs, which don’t preserve snapshots of what their WAR values used to be, Baseball-Reference has generated a daily log of its WAR values for all years and all players since March 29, 2013, when B-Ref and FanGraphs adopted the same replacement level for consistency’s sake, a change that raised all full-time players’ seasonal WAR values at B-Ref by about 0.2 to 0.4 wins. (Baseball Prospectus still uses a separate replacement level from the other two sites.) That was a more meaningful change than most, but the site has continued to tinker with WAR in more minor ways. I enlisted the help of Harish Swaminathan, a data analyst who blogs about football at NFLGraphs, to plot the changes from March 29, 2013, to March 21, 2019, in the batter and pitcher WAR values for four past seasons: 2012, 1992, 1952, and 1912.
The charts below, which span the past six years, show the average cumulative absolute changes in 2012, 1992, 1952, and 1912 WAR for all qualified batters and pitchers. The book was closed on all of those seasons prior to March 29, 2013, so the changes in the chart represent adjustments to WAR that retroactively altered the old WAR values. These are absolute changes, so positive and negative revisions both build toward the total. For reference, the average qualifying hitter was worth about 3.1 WAR in 2012, and the average qualifying pitcher was worth about 2.4 WAR. (On the whole, pitchers were worth more in earlier eras, when workloads were heavier.)
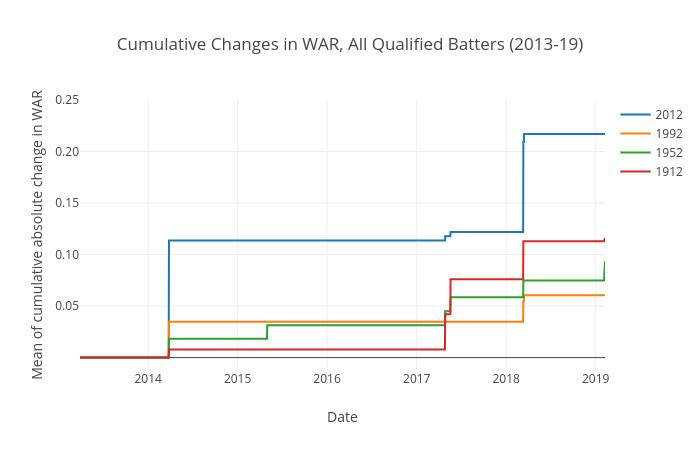
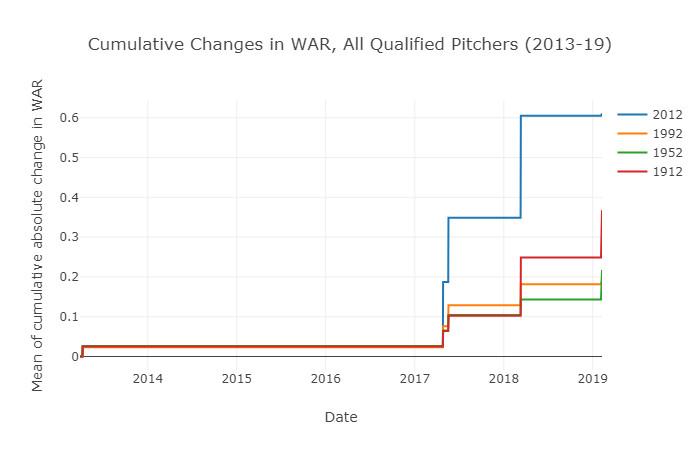
Those charts tell us a few things. First, WAR at Baseball-Reference is static most of the time; updates tend to occur on an annual basis, usually close to Opening Day. Second, the amount of variation depends on the nature of the adjustment and the era in question; the 2012 WAR values shifted more than the values from the earlier years. Third, although the pitcher WAR values didn’t change at all for a few years, they’ve since changed much more rapidly than the hitter WAR values. On average, hitter WAR from 2012 has changed by close to a quarter of a win, on average, while pitcher WAR has changed by more than six-tenths of a win.
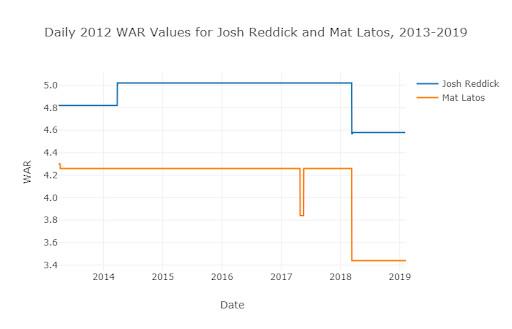
Is that a lot or a little? Well, it’s a lot compared with, say, ERA or OPS, which haven’t changed at all. It’s a little in the sense that no one went from good to bad or vice versa, although the changes can be pronounced in individual cases, such as Josh Reddick and Mat Latos.
Of course, this sample starts when B-Ref’s WAR was already on Version 2.2, so those plots don’t include several significant changes that preceded March 29, 2013. What’s more, B-Ref’s WAR has likely changed less since that date than the equivalent metrics at BP and FanGraphs. Both of those sites have factored catcher framing into their WAR(P) stats—BP in 2016 and FanGraphs last week—which B-Ref has yet to do. (Given that B-Ref does publish framing stats on the site, that change is likely unavoidable, and other alterations may follow.) FanGraphs has also incorporated a new methodology for defensive stats that tends to dampen extreme values, and BP has entirely replaced its previous pitching and hitting measures with deserved run average and deserved runs created, respectively. Over the past four years, WARP was essentially stripped down to the studs and rebuilt.
In a sense, it’s unsettling that WAR is always in motion. Batting average may not be an accurate indicator of overall (or even offensive) value, but barring an overturned ruling by an official scorer or an unearthed error in archaic records, it always stays the same. Ted Williams will always have hit .406 in 1941, but his FanGraphs WAR for that season was 11.9 in 2011, and today it’s 11.0. That’s one reason WAR values may never achieve the emotional resonance of evocative stats such as .406, 56, or 755, or even milestones like 3,000 hits or 500 homers.
WAR reminds us that objective truth tends to be slippery. And the metric is likely to get more unstable before it someday settles down. None of the big three versions of WAR(P) currently incorporates Statcast data. Thus far, MLBAM has drawn on that data to quantify aspects of player production without generating one unified number, but Tango describes it as “inevitable” that “eventually they will get rolled into one Statcast WAR metric.” He acknowledges that WAR’s amorphousness may make some fans more hesitant to trust it. Even so, he says, “Our focus should be on representing the truth as best we can estimate it. And it’s the truth that will attract the people.”
Baseball-Reference founder Sean Forman has responded to criticism of WAR’s mutability—not to mention its multiple implementations—by comparing it to gross domestic product (GDP), another complex statistic that also changes retroactively and comes in more than one form. WAR works the way all science does: Discoveries are scrutinized, assumptions are examined, errors are rooted out, and breakthrough by breakthrough, we learn.
At times, that learning process is painful, but with WAR the stakes are fairly low; a few people whose passwords come from the combined career WAR totals of their favorite players may have to memorize a new number, but no one will die because WAR said someone was slightly better or worse than he was. That said, a fluctuation in WAR could cost someone money.
By and large, there is still that element of, ‘What’s on the back of the baseball card?’MLB agent Jim Munsey
Munsey doesn’t subscribe to the argument that the Rays and other teams are trying to cut costs by embracing the opener. “At first it [was], ‘The cheap Rays, they’re trying to devalue their pitchers,’ which I don’t really believe and haven’t believed from the beginning,” Munsey says. “I don’t think it was an economic thing.” The agent allows that Yarbrough would rather belong to a regular rotation, but he says that his client hasn’t complained about being the bulk guy and has come to view the role as “a quicker way to the big leagues and a better way to actually stay here.”
Munsey doesn’t worry that Yarbrough’s lack of starts as a rookie will hurt him in arbitration, which tends to depend heavily on performance in the “platform” year—the season immediately preceding the player’s arbitration eligibility. But if Yarbrough continues to be a bulk guy, it could conceivably come back to bite him. “Platform’s always the most important,” Munsey says, adding, “I don’t know that the first year really moves the needle much. … The second year does start to move it, and the third certainly would.”
In the wake of his successful lobbying efforts on Yarbrough’s behalf last year, Munsey is confident that he can persuade arbitrators to treat the southpaw as a starter too. “I still refuse to think that they’re going to say, ‘Aha! He’s just a reliever,’ you know? Because it’s such a specious argument.” It can’t hurt that while being the bulk guy deprives Yarbrough of starts, it also puts him in a perfect position to pick up wins; last year, he finished 16-6.
Still, a higher WAR would help. “There’s more and more sabermetrics as you go along, from an arbitration standpoint, that are used,” Munsey says. “But by and large, there is still that element of, ‘What’s on the back of the baseball card?’” WAR actually has been on the backs of some baseball cards, because its concept is simple, even if its innards are complicated—and even if the numbers that were printed on cards from five years ago are now out of date. “WAR, I think, even people who generally look at the back of a baseball card can understand,” Munsey says. “This is the be-all, end-all. [It’s] easier to compare everybody, even from year to year, generation to generation. We use this, and I think it’s becoming more acceptable and easier to understand for people, for the arbitrators themselves.”
Rod Blunck, an analyst for the Octagon agency, confirms that WAR has been cited consistently in arbitration for 3-4 years, and that it has swayed certain cases. WAR is handy because it can be summarized in the hour allotted for the player’s presentation, although if one WAR variant is high on a player and another is not, it may be best not to bring up either. “If there is a big difference between the two for your client, the one you don’t use will be thrown in your face in rebuttal,” Blunck says.
Some versions of WAR have flip-flopped on plenty of players over the past three or four years. Consider Rays catcher Mike Zunino, who’ll be one of Yarbrough’s batterymates this year. Thanks to a boost from framing, Zunino’s career WAR at FanGraphs rose from 7.0 at the start of this month to 13.0 today, and his platform-year WAR more than doubled. Zunino, who was eligible for arbitration this winter, wound up settling with the Rays for $4.4 million. Had he gone to arbitration, though, that difference in WAR might have made a difference. The algorithms that govern WAR aren’t interested in timing: A crucial base knock in the ninth counts the same as a meaningless, stat-padding single in a blowout. But depending on the player, the timing of what WAR says may matter a lot.