

In 2000, the New York Mets won the National League pennant. In 2001, they won 82 games and missed the playoffs. Smarting from defeat, the franchise’s front office set out to win the subsequent offseason, with an eye toward returning to October in 2002. In short order, several staples of the Subway Series squad (Robin Ventura, Todd Zeile, Benny Agbayani, Lenny Harris, Glendon Rusch) were out. Several sluggers (Roberto Alomar, Mo Vaughn, Jeromy Burnitz), speedsters (Roger Cedeño), starting pitchers (Shawn Estes, Pedro Astacio, Jeff D’Amico), and setup men (David Weathers, Mark Guthrie) were in. “2002 Mets: Rebuilt to Go the Distance,” a New York Post headline proclaimed on Opening Day.
Instead, the Mets went 75-86 and finished last in the NL East. The aggressively reconstructed club, one columnist declared, was “the most expensive flop in baseball.”
The legacy of that team—and others that had huge offseasons, only to fizzle in the following year—still hangs over the present-day Mets, who have overhauled their whole club after a late-season collapse (another Mets tradition) left them 83-79, a tiebreaker win away from the postseason. Before New Year’s, president of baseball operations David Stearns bid goodbye to stalwarts Edwin Díaz, Pete Alonso, Brandon Nimmo, and Jeff McNeil, overturning the team’s identity. He replaced the departed players, and pursued other upgrades, in the form of both bats (Bo Bichette, Luis Robert Jr., Jorge Polanco, Marcus Semien) and arms (Freddy Peralta, Devin Williams, Luke Weaver, Luis Garcia, Tobias Myers). Stearns has stayed busy: On Roster Resource’s offseason tracker, the Mets lead all teams in additions and rank third in subtractions.
Sure enough, now that the transactions have slowed, the resulting roster seems strong. The Mets’ mostly new-look lineup and bullpen, plus Peralta’s presence atop the rotation, have sweetened tabloid headlines from December’s “Ya Gotta Bereave” to January’s “Haul of a Job.” Suddenly, everything’s coming up Mets—except for one nagging concern. (Not counting the lurking specter of Craig Kimbrel, of course.)
“All that is keeping me from really liking this Mets offseason is history,” Post columnist Joel Sherman wrote last week. “That generally the teams perceived as winning the winter so often follow by being among the biggest disappointments of the actual season.”


More in MLB
The Mets don’t have a clear-cut case to be MLB’s biggest winners of the winter—the Dodgers, Cubs, Orioles, and Red Sox, among others, might like a word—but Sherman is right to sound a cautionary note. By taking a cleaver instead of a paring knife to what was a decent (albeit disappointing) team, the Mets have already strayed from the sport’s standard operating procedure. If their offseason strategy works, and the revamped roster wins more games than the old one did, they’ll have bucked baseball history to an even greater degree. While it’s hard to argue with the wisdom of getting good players, the past 125 years or so of hot stove history—and extreme team makeovers—have taught us that turnover tends to be bad.
To assess a team’s turnover rate from one season to the next, we can calculate the percentage of total playing time (as measured by plate appearances and batters faced) across the two campaigns accrued by players who were present in both seasons. This method of determining how much such clubs had in common accounts for all types of turnover: not only exports and imports, but also callups, injuries, and other promotions and demotions in role. When we run the numbers for all AL/NL teams dating back to 1898 (when Retrosheet’s NL box score data begins), a clear pattern appears.
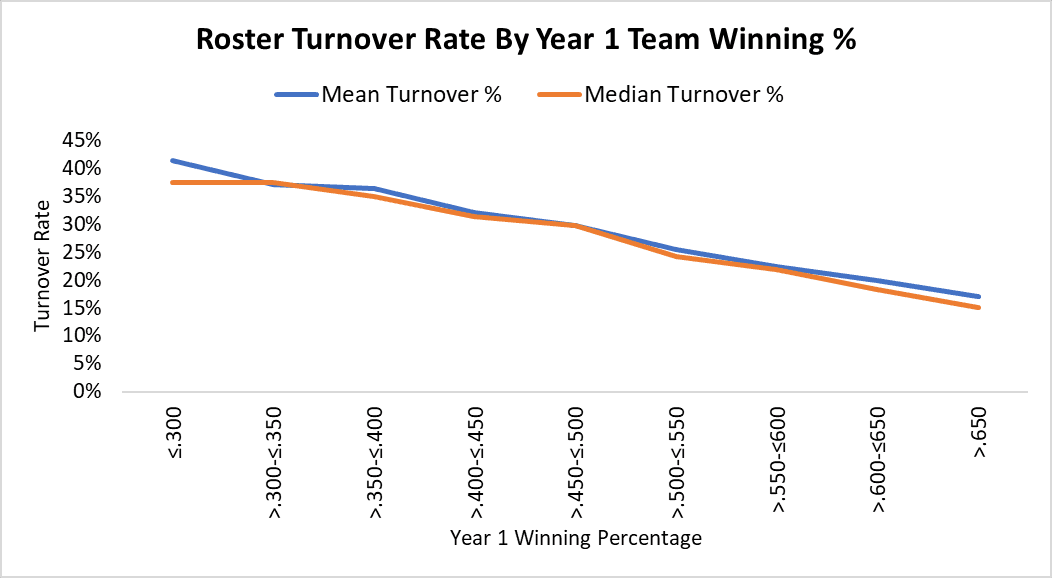
The graph below shows the mean and median roster turnover rates for teams in various buckets of regular-season success, with winning percentages ranging from below .300 to above .650. In general, the higher a team’s winning percentage in Year 1, the lower its turnover rate tends to be.
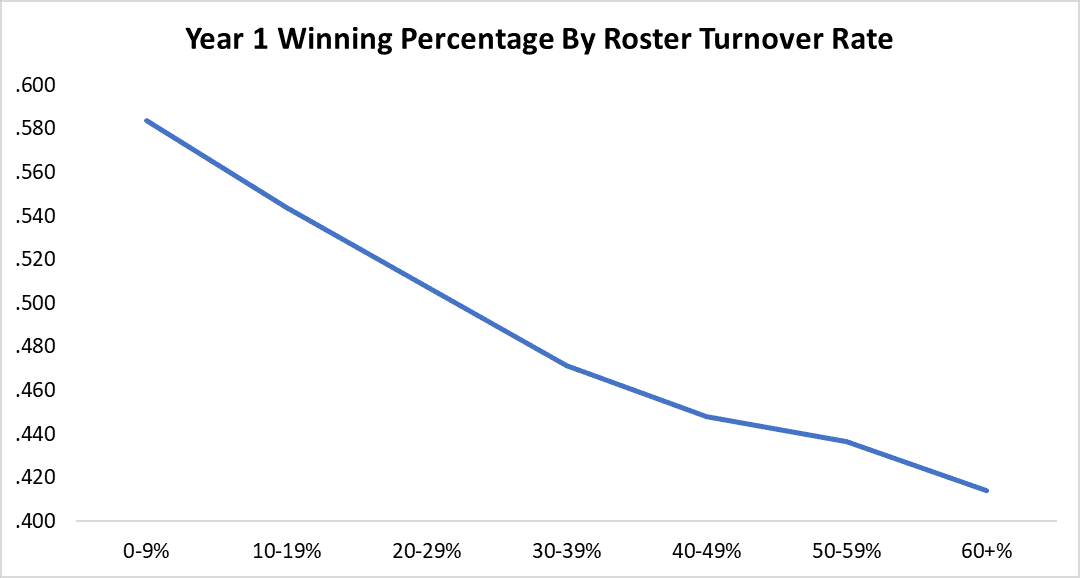
Here's another illustration of the same trend. If we sort teams by turnover rate, from the lowest-turnover cohort of 0-9 percent to the highest-turnover cohort of greater than 60 percent, we see that the lower a team’s turnover rate, the higher its Year 1 winning percentage tends to be.
Teams with losing records in Year 1 have collectively recorded mean and median turnover rates of 32.4 percent and 31.8, respectively. Teams with winning records in Year 1 have collectively recorded mean and median turnover rates of 23.2 percent and 22.2 percent, respectively. This difference isn’t especially surprising. Losing teams have more work to do to get good, while winning teams have more incentive to stand pat. Both PR-wise and in terms of talent, losing teams face steep pressure to reshuffle their rosters. Winning teams often opt not to mess with success.
The Mets weren’t a bad team in 2025. Although they spectacularly flamed out of playoff position, they spent 178 days last season either leading the NL East or no worse than tied for the third wild card (disregarding tiebreakers). That 178-day tally—consisting of March 28, plus every day from April 5 on—equaled a record for a non-postseason team, which was set by the 2007 Mets, who held a seven-game division lead on September 12 but lost 12 of their last 17 games to cede the title to the Phillies.
Last year’s Mets missed the playoffs by such a narrow margin (after making the playoffs by an equally narrow margin the previous year) that they could have convinced themselves they were a few tweaks away from fixing their flaws this winter. Another New York Post columnist, Jon Heyman, argued as much in December. In a piece entitled, “The Mets have blown it all up—and for what?”, Heyman wrote, “they’ve taken a sledgehammer to a roster that only needed a scalpel or two.”
Since the dust settled on the Mets’ major moves, Heyman has changed his tune. But what can we conclude about the Mets based on how aggressively they’ve reshaped their roster?
It would seem to bode well for New York that the higher a team’s turnover rate, the better its winning percentage tends to be in Year 2 compared to Year 1. For example, teams with turnover rates above 60 percent tend to improve the next season by about 20 points. Teams with turnover rates below 10 percent tend to decline by about the same margin.
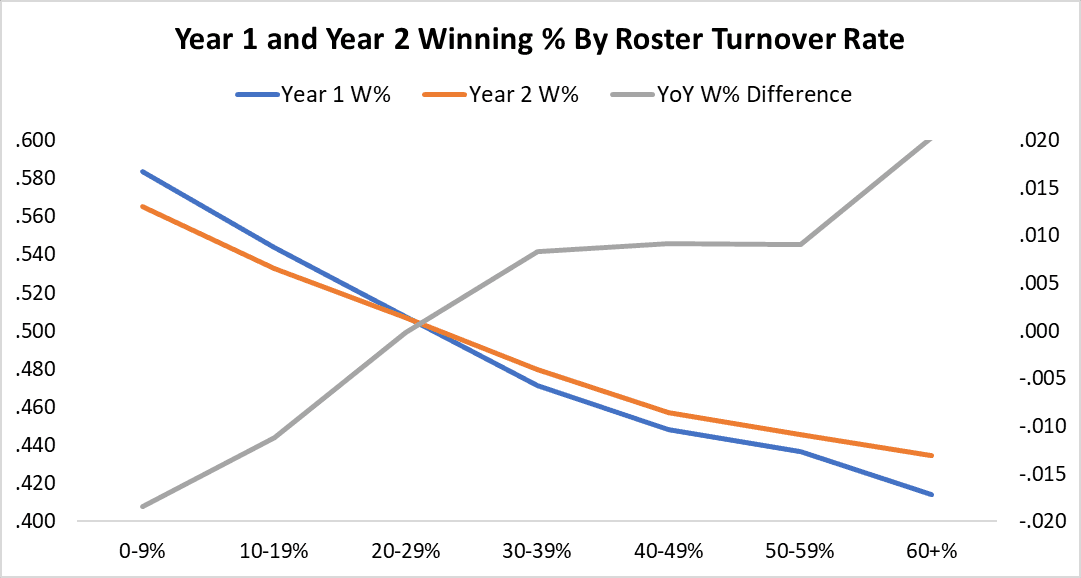
However, that’s purely a product of a confounding factor we already identified: As a group, terrible teams have high turnover rates, and great teams have low ones. In both directions, regression to the mean makes its influence felt. In general, bad teams tend to get better the next season and good teams tend to get worse, not just because of different turnover rates but because of better luck.
But what if we hold winning percentage constant? If we isolate the effect of turnover rate, independent of starting team quality, is there any good news for the Mets?
Again, going by historical comps, not really. I grouped all teams into 25-point buckets of winning percentage, then compared the higher-turnover half of teams to the lower-turnover half of teams within each bucket. (So, for instance, I limited the sample to teams with winning percentages between .300 and .325 in Year 1, sorted qualifying teams by turnover rate, and then compared the least stable half of those teams to the most stable half of those teams. Then I did the same for each group through the .625-.650 range.) In every bucket, the high-turnover teams tended to do worse in Year 2 than the low-turnover teams, relative to their records in Year 1.
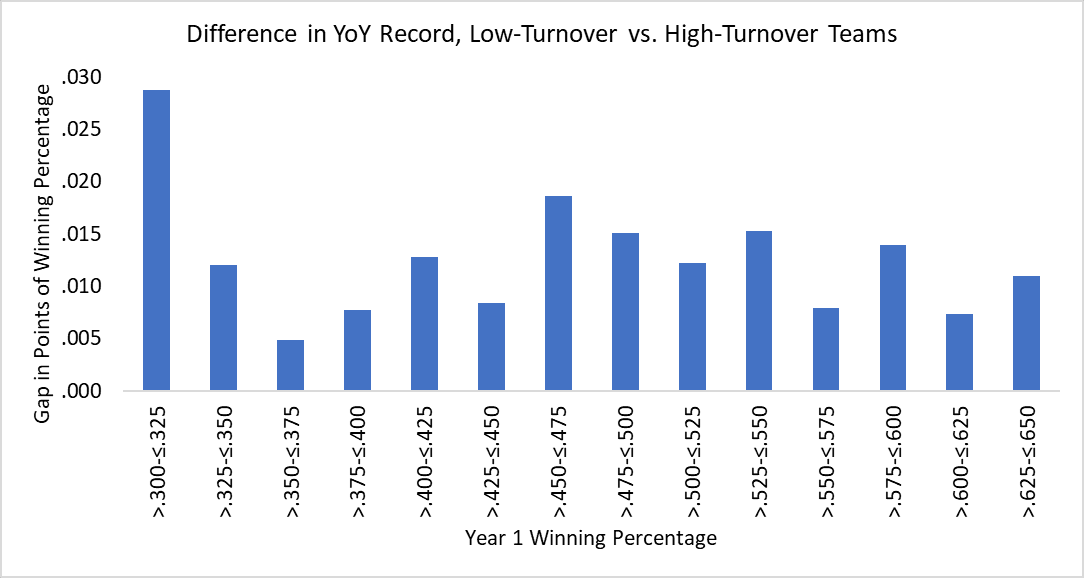
In other words, given two teams with equivalent records in Year 1, the one with the lower turnover rate is usually a safer bet to compile a better record in Year 2—presumably because teams are skilled self-evaluators, and those that know they don’t need reinforcements are less likely to go get them. (Granted, some winning clubs become complacent.) Plus, team-building tends to be a painstaking process, and it’s difficult to dramatically reconfigure a roster in a hurry and have those plans pay off.
In Alonso, Díaz, Nimmo, and McNeil, the Mets parted ways with four players who had continuous tenures of at least seven years with the team (though Díaz’s stint was only six seasons, because he missed 2023 after injuring his knee in the World Baseball Classic), and combined for almost 80 FanGraphs WAR as Mets. Although that sounds like a lot to lose all at once, exoduses on that order occur once or twice per season, on average. However, they’re more infrequent among winning teams, and even more rarely do significant departures from winners presage an improved winning percentage in the post-exodus season. That same maxim applies to turnover rates on rosters writ large.
The table below lists history’s highest-turnover teams, led by the infamous 1898-99 Cleveland Blues:
AL/NL History’s Highest-Turnover Teams
As one might imagine, special circumstances abound: wars, fire sales, strike seasons, and more. As for the teams with the lowest turnover rates—well, with few exceptions, they’re ancient history.
AL/NL History’s Lowest-Turnover Teams
What we’re really after, though, are possible precedents for these Mets. So let’s look at the highest turnover rates among teams with winning records in Year 1:
AL/NL History’s Highest-Turnover Teams With Winning Records in Year 1
Only 19 teams with a winning record in Year 1 have turned over at least half of their rosters. Of those 19, only two (the 2003-04 Yankees, and the 2023-24 Padres) posted improved records the next year—if we go by Baseball Reference’s records, at least. By one definition, those Yankees suffered the most devastating offseason ever: Players who were part of the team in 2003 but not in 2004 amassed 29.2 WAR, the biggest year-over-year value loss since 1901. Yet after winning 101 games in 2003, the Yankees won … 101 games in 2004. They show up on this winning-percentage-improvers list only because Baseball Reference awards them a tie in 2003 for an official five-inning game that was later made up. (It was weird.) It helped that the Yankees of that era drastically outspent everyone, and signed the likes of Gary Sheffield, Paul Quantrill, Tom Gordon, and Jon Lieber entering 2004. As for those recent Padres, they were wildly unlucky in 2023.
David Stearns’s talented, Frankenstein team might have a chance to turn that twosome into a trio. The 2025-26 Mets have a projected turnover rate of 43.2 percent, based on actual playing time from last year and projected playing time for this year per the FanGraphs depth charts. That’s likely to undershoot their final figure, though, given that FanGraphs can’t account for future acquisitions and injuries, which would likely lead to extra, unanticipated turnover. Even if the Mets don’t crack the club above, they’re bound to be unusual. (When aren’t the Mets unusual?) Of the 1,361 qualifying teams with winning records in Year 1, only 57 (4.2 percent) had a turnover rate as high as even the Mets' current projected rate. Of those 57, only 13 (22.8 percent) had a higher winning percentage in Year 2. One way or another, if the Mets top their 2025 record, they’ll be beating the odds.
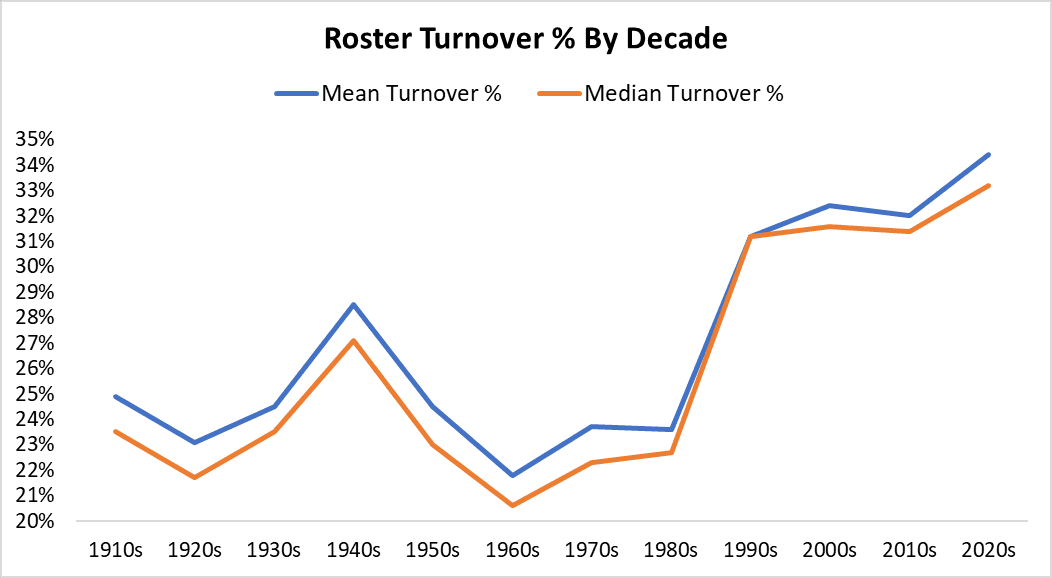
One caveat to the foregoing: As previous research has shown, MLB has entered a high-turnover era. For most of the 20th century, year-to-year roster turnover rates hovered not far above 20 percent, with spikes in the 1910s (primarily because of competition from the Federal League) and the 1940s (primarily because of World War II). But the destabilizing effects of free agency began to be felt in earnest in the 1990s, and this century, turnover rates have climbed well into the 30s.
In a sense, then, the Mets are a team of their time, and their turnover rate is a little less anomalous than it seems on the surface. Still, their rate is elevated even by 2020s standards. Not all of MLB’s top teams have embraced change this winter. In fact, one need only look across town to find an example of a team that’s followed a very different (and far more placid) path from contending in 2025 to aspiring to contention in 2026: the Yankees.
The two New York clubs are a study in offseason contrasts—and, funnily enough, impending-season similarity. The Yankees have re-signed several free agents—most notably Cody Bellinger and Trent Grisham—since their ALDS loss, but their only prominent new addition is former Marlins starter Ryan Weathers. They’re banking on Gerrit Cole’s comeback from Tommy John surgery, a post-surgery bounceback by Anthony Volpe, and the returning talent that yielded the AL’s best run differential and MLB’s best BaseRuns record last year. The Mets have to get good enough to be a playoff-caliber club; the Yankees, coming off a 94-win season, just have to stay that way.
The Bombers have been boring this winter, compared to the tumultuous Mets. Yet as we’ve established, being boring can bode well, provided a team is good to begin with. The Yankees’ projected roster turnover rate is only 17.1 percent, far less than half as high as the Mets’. In terms of projected team WAR, though, the Yankees and Mets rank second and third, respectively, behind the Dodgers, and they’re separated from each other by only one win. Amusingly, they’re each also within one projected win of where they were a year ago, even though the Mets’ roster bears a lot less resemblance to its January 2025 self than the Yankees’ does. There’s more than one way to win a winter—and more than one way to win.
So, what have we learned? In essence, Sherman was right: A hyperactive offseason is sufficient reason to doubt a team, in the abstract. But the 2026 Mets aren’t an abstract concept; they’re a specific squad whose makeup and outlook we can assess. The Mets underperformed their BaseRuns record by nine wins last season—more than any other team—which suggests that they were better than their record reflected. And now they’ve flexed their financial might (and creative thinking) to pull off a formidable refresh, all without locking the team into additional long-term commitments. Not many teams have managed triumphant transformations of the kind they’re trying to engineer, but history hasn’t doomed them to a deflating season.
Maybe it’s an ominous omen that the Mets’ projected WAR total is almost identical to what it was this time last year; they certainly didn’t do all this winter work just to suffer the same fate that befell them in September 2025. Then again, they’d probably sign up for a regular season that starts the same as last year’s—as long as it ends differently.
Thanks to Ryan Nelson and Michael Mountain for research assistance.