What would we learn if we could see what an MLB team’s scouts saw? For the first time, we can: A former member of the Cincinnati Reds front office provided The Ringer with a copy of the Reds’ scouting database from between 1991 and 2003, consisting of more than 73,000 reports. Throughout this week, we’ll be using this newly declassified scouting gold mine to analyze old-school scouting’s strengths and weaknesses, profile players who defied the scouts’ expectations, and examine how scouting has evolved in recent years. In Monday’s Part 1, we crunch the numbers on how well scouts projected players.
Almost 20 years ago, in November 1999, the Seattle Mariners’ All-Star center fielder, Ken Griffey Jr., requested a trade. Citing a desire to travel less and spend more time with his family, Griffey rejected an eight-year extension offer and, leveraging his veto rights as a 10-and-5 player, reportedly gave the Mariners a list of four teams to which he would accept a trade, all of which had won at least 96 games in 1999: the Atlanta Braves, Houston Astros, New York Mets, and Cincinnati Reds.
In the fall of ’99, five Reds scouts who had seen him that season filed reports on Griffey, who had grown up in Cincinnati and whose father was the team’s hitting coach.
“Outstanding tools across the board!” one scout wrote. “A future Hall of Famer. Is only active player with a chance to break Hank Aaron’s home run record and would like to see him do it in Cincinnati. Has ability to carry a club to the world series. Tremendous fan appeal, will sell tickets. If have a chance, would acquire.”
Another scout was even more effusive. “Best all-around player in baseball. Can do it all. IS THE MICHAEL JORDAN OF BASEBALL. Will personally sell more tickets than McGwire or Sosa. Can hit, hit with power, run, field & throw. Get 25 of this guy and you will have the best team in the history of baseball. Is a true franchise player. If you can acquire him, go get him! One of the best players in baseball that I would recommend paying top dollar for.”

According to a stat that didn’t yet exist in 1999, wins above replacement, Griffey, who was weeks away from his 30th birthday when he went public with his trade desires, had been to that point in MLB history the 12th-most valuable position player during his 20s. The grades the Reds scouts bestowed on him reflected his résumé, which included 10 consecutive All-Star appearances and Gold Gloves, a 1997 AL MVP Award, and four AL home run crowns. Two of the scouts rated his power as an 80 on the 20-80 scouting scale, with the others hedging slightly at 75. Four gave him a 70 hit tool, and the same four deemed him a 70 base runner. None of them saw him as less than a 75 fielder. His arm grades clustered close to 70, his “instincts” averaged upward of 75, and the one-word descriptors in a part of each report intended to assess a player’s aggressiveness spoke to the scouts’ respect for his character: Gamer. Winner. Leader. Competitor.
Griffey had been as great as the Reds’ scouts were saying. But he was past the typical player’s prime age and was coming off his least valuable full season. Despite those glowing grades, he had only one star-level season ahead of him when the Reds acquired him in February 2000 in exchange for Mike Cameron, Brett Tomko, Antonio Pérez, and Jake Meyer and signed him to a nine-year, $116.5 million deal.
The Reds were widely believed to have gotten a bargain on both transactions, but in retrospect, the deal wasn’t a win for Cincinnati. Not only did Griffey not carry the Reds to the World Series, but after 2000, he couldn’t carry them to a winning season. The Reds opted to trade Cameron instead of shortstop Pokey Reese, in part because they had already traded for Dante Bichette, whom their scouts saw as a power-hitting replacement for free-agent slugger Greg Vaughn but who was barely a replacement-level player at that point. Cameron, who earned much more modest grades in a 1999 Reds report, went on to be worth more in four seasons in Seattle than Griffey would be in eight-plus seasons in Cincinnati. It could have been worse for Cincy: Meyer (whom one 1999 Reds report said “has the stuff to pitch out of the bullpen at the ML level”) never made the majors, and Pérez (“has the tools to become very good and have value to us at the big league level”) totaled 0.6 WAR for three teams in parts of four seasons.
A little more than two years after that trade, when Griffey was scuffling to a roughly league-average slash line amid multiple injuries, the Reds acquired the franchise player they’d thought they were getting in Griffey. Even inside the organization, though, not everyone knew it. One Reds scout wasn’t impressed with the player his club had selected with the 44th pick in the 2002 amateur draft, a high school catcher named Joey Votto. “To date has been way out of his element,” his 2002 Votto report read. “Not ready for pro ball.” The scout lamented the lefty’s “long slow uppercut swing”; noted, “Different attitude probably the result of Canadian background”; and concluded, “Not a ML prospect. Expressed love for the game in predraft conversation. He’ll need it.”
A subsequent report by the same scout added, “Have no idea where he can play defensively. … No feel for how to play this game. A loooong project.” By the end of the year, the scout’s tone had softened somewhat. He praised Votto for being “a sponge for information,” but he also warned, “Approach is basically all or nothing” and allowed only that Votto “Has a chance to be a Brad Fullmer type player. … Possible Greg Colbrunn type from the left side.” Of course, the scout’s skepticism was common; 27 teams passed on the best hitter in the draft class before the 44th pick—including the Moneyball A’s seven times—and Baseball America didn’t rank Votto among baseball’s best 100 prospects until 2007, the year he made the majors.
Scouting is hard.
Thanks to a newly unearthed archive of information and the benefit of hindsight, we can quantify with improved precision how hard it is—or, at least, how hard it was in the 1990s and early 2000s. Those Griffey and Votto reports are part of a massive scouting database obtained by The Ringer from a former member of the Reds front office. The collection contains almost 60,000 reports on pro players across all organizations filed from 1991 to 2003 and more than 13,000 reports on amateur players filed from 1998 to 2003, encompassing all of the era’s top talents as well as long-forgotten fringe prospects who never made it to pro ball, let alone the majors. Although the Reds reports aren’t recent and represent the fruits of only one franchise’s labor, they offer an unprecedented public look at the output of an MLB scouting department in the period immediately preceding the mass onset of the sabermetric revolution.
Throughout this week, we’ll be mining this resource for statistical insights, using it to tell stories about certain players’ careers, and comparing and contrasting the way scouting once worked with the present state of the art. In Part 2 of this series, we’ll be talking to former players about why they exceeded or fell short of the futures Cincinnati’s scouts envisioned for them, as well as speaking to one standout scout about the secrets to his prescience. In Part 3, we’ll explore how scouting has evolved in the past 15 years to address some deficiencies of earlier eras. And in today’s leadoff piece, we’re diving deep into the database to see what this scouting time capsule can tell us about the perils and potential of projecting player performance.
OFP, Predictiveness, and Compression
It’s not easy to summarize the success of the turn-of-the-century Reds. Over the 13-year period covered by the archive’s pro reports, the Reds posted a cumulative .498 winning percentage, which ranked 14th of 30 teams in that span. But they fluctuated between being one of the worst teams and one of the best, ranging from a low of 66 wins to a high of 96. In the year the database begins, they were defending world champions. In the year it ends, they were through the first three of what would be nine consecutive losing seasons.
It’s more difficult still to assess how the Reds’ scouts stacked up their contemporary rivals. According to data from The Baseball Gauge, the 1991-2003 Reds ranked 14th in WAR produced from the draft and 19th in “homegrown” WAR, or WAR generated for the team by players who hadn’t previously played for another organization, although players added toward the tail end of that period (like Votto) wouldn’t count toward their totals. Those are imperfect measures of the Reds’ relative scouting acumen in that era, considering that scouting has an impact on all methods of player procurement and given the challenge of separating a team’s proficiency in scouting from its aptitude for player development, which work hand in hand and can mask each other’s influence. A team that excels at importing talent may still struggle to produce capable big leaguers if it can’t help that talent mature.
What we can say is that every team has more misses than hits when it comes to acquiring young players. Data from Baseball Prospectus reveals that only 13.6 percent of all players who entered the minor leagues from 2006 to 2008—long enough ago that we can distinguish the hits from the misses—ended up making the majors. In a 2014 study, BP’s Russell Carleton tried to “shy away from the idea that the draft is a complete and total crapshoot,” but relying on draft data from 2003 to 2008, he concluded that “past performance here is not indicative of future results” and that “there’s a lot of dumb luck that goes into whether a team succeeds or fails.” (Carleton just joined the Mets, who could use a little luck.)
The Reds’ old amateur reports support that statement. Most teams’ scouts assign amateur players an “OFP,” or overall future potential, an industry-standard score on the 20-80 scale that reflects a scout’s expectations for a player’s career outcome. Every team has its own recipe for generating an OFP from a player’s tool grades, and scouts differ in how actively they intervene to arrive at the number they want. “Some scouts will just grade out grades and there’s your OFP,” says Frank Marcos, the former longtime director of the MLB Scouting Bureau. “Some scouts will look at it and say ‘Well, I want this OFP on this player, now I’ve gotta make the grades kinda fit that.’”
The Reds’ reports on amateur players show only slight relationships between OFP and career length and OFP and career production (as represented by wins above replacement player). The table below lists the weak correlations; zero would indicate no relationship, while one would represent a perfect relationship.
OFP Predictiveness
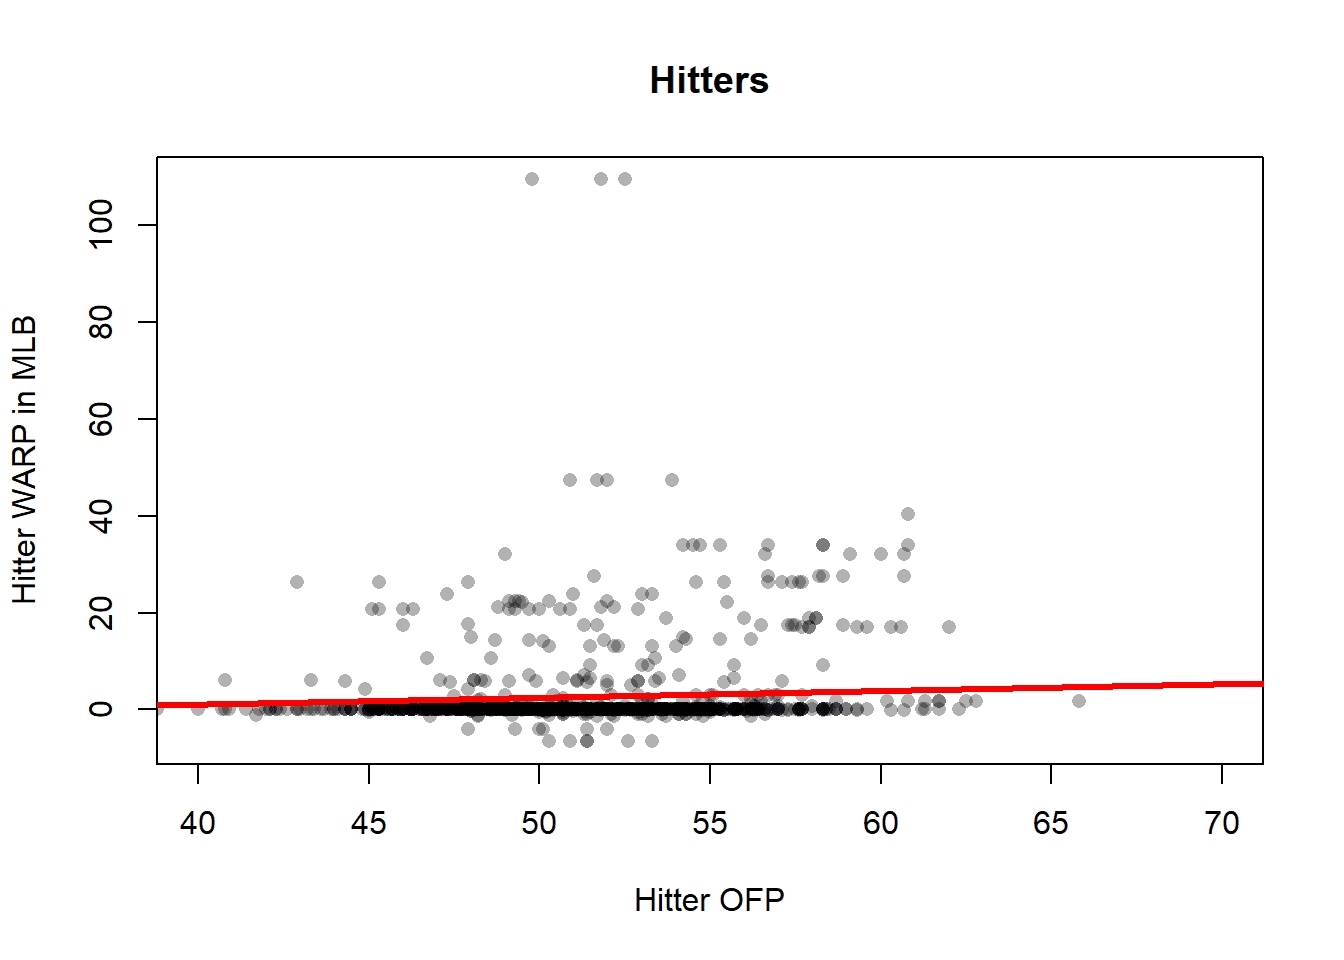
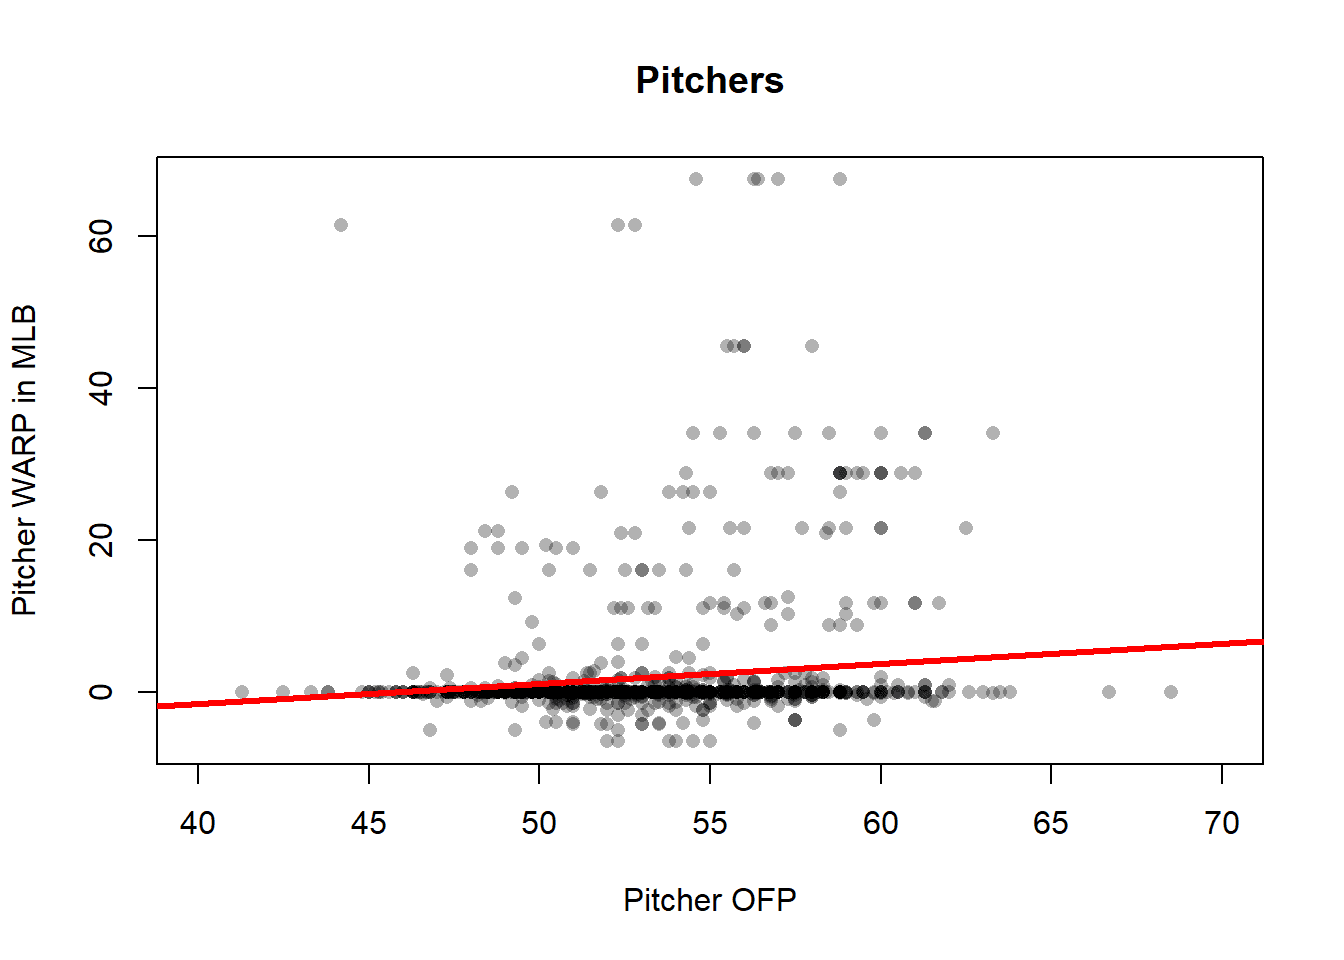
The following graphs for hitters and pitchers, which plot OFP against career WARP, reinforce the idea that OFP grades are only a little bit better for prognostication purposes than throwing darts at a draft board. If OFPs were predictive, we would see diagonal lines ascending upward. Instead, they’re almost flat.
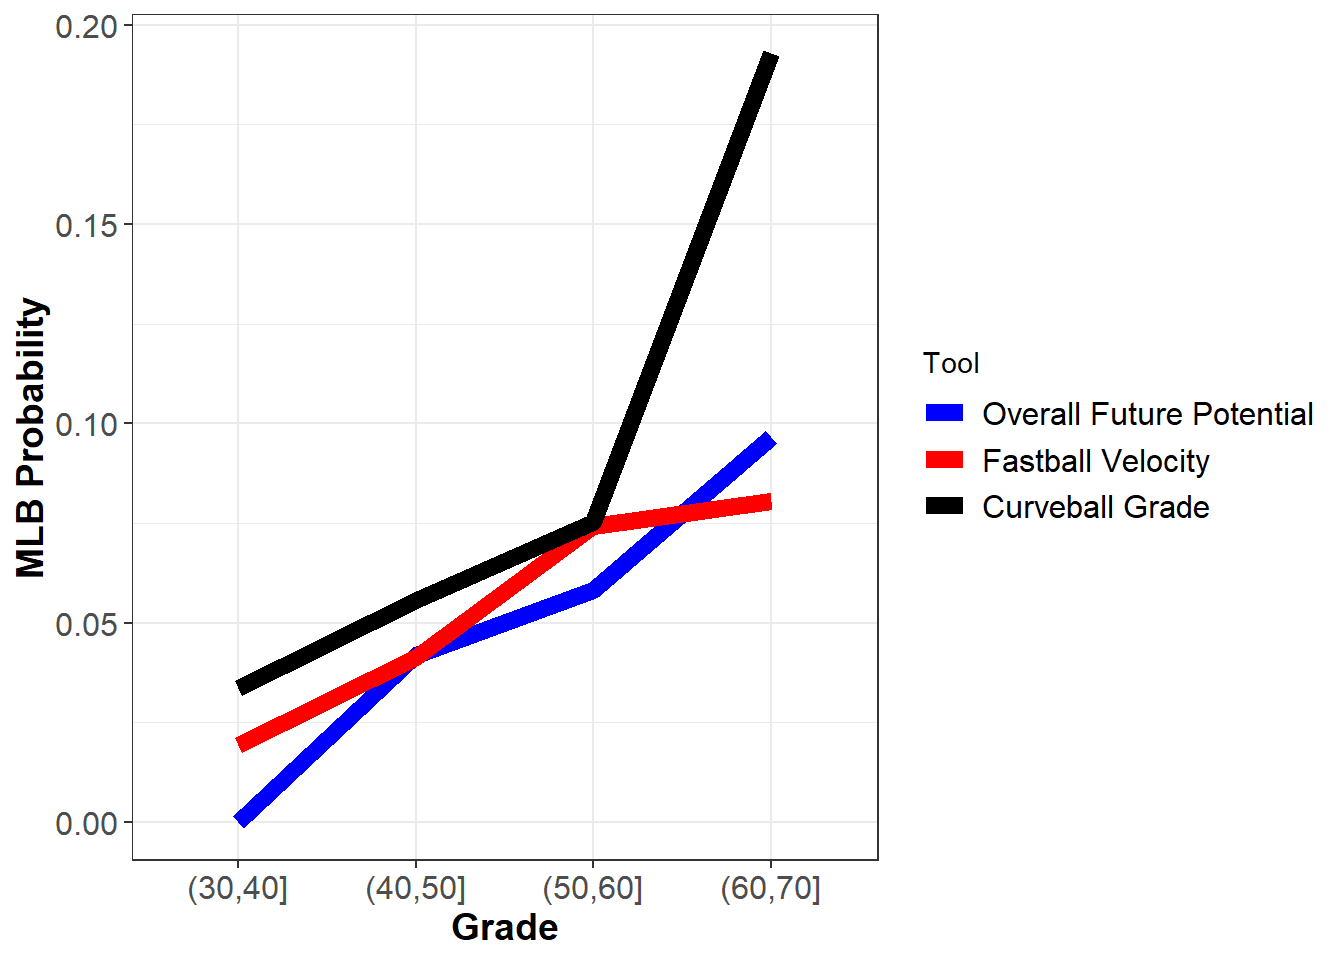
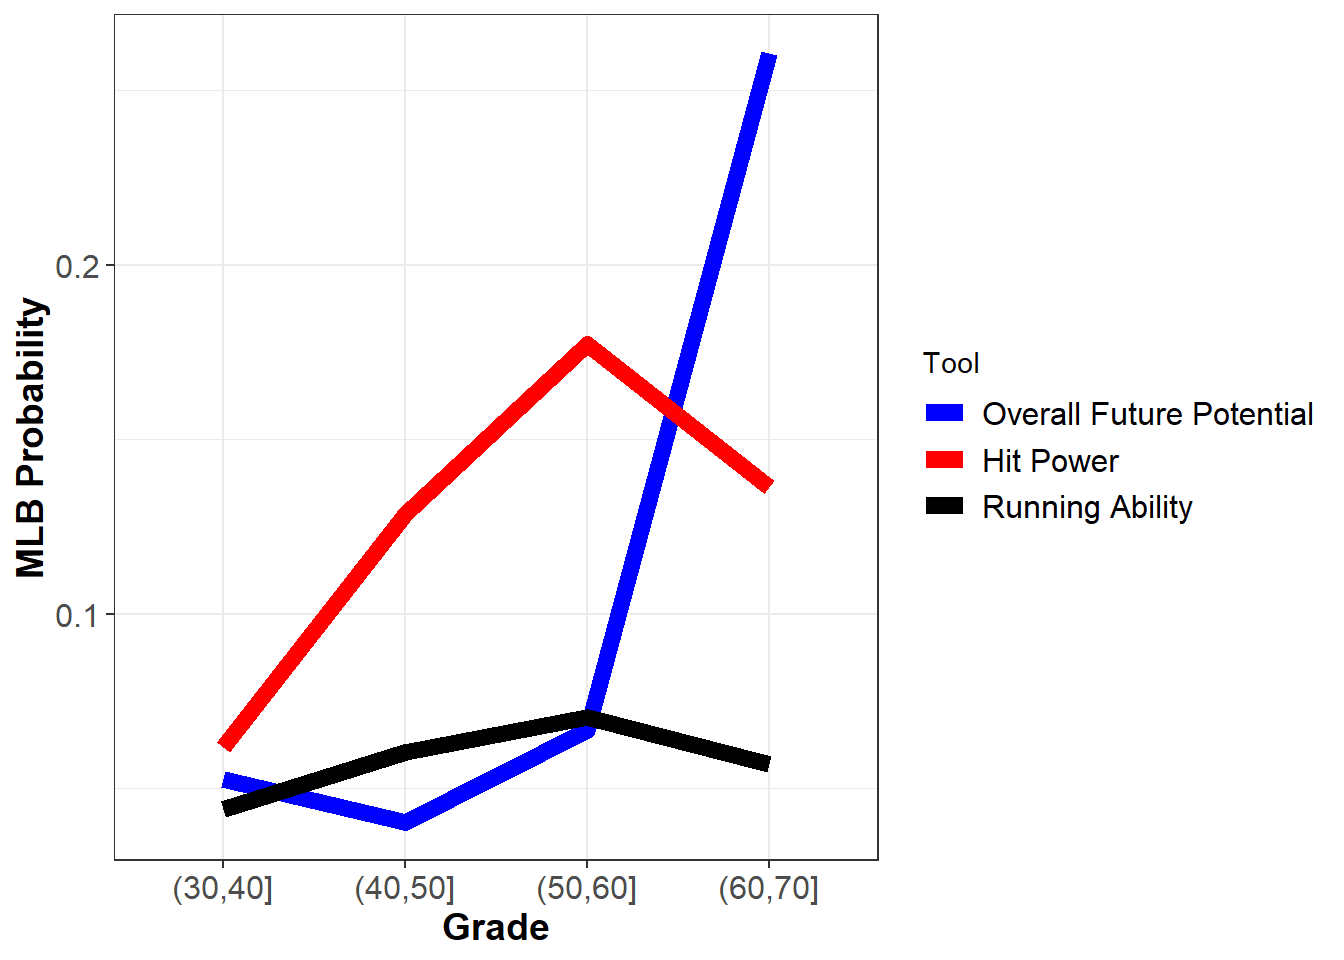
Although the OFP grades weren’t telling, some of the more granular grades yielded more predictive power. For hitters, “hit power” and “hit power future” were the best predictors of future WARP—roughly twice as strongly correlated as OFP alone. Instincts, bat speed, and arm speed were also better predictors than OFP. Pitcher OFPs were slightly more accurate than hitter OFPs on the whole, but fastball velocity and life were better correlated with career WARP than OFP alone. The number of reports filed on a particular player was also about as predictive as his OFP grades; if the team had enough interest in someone to send scouts to see him repeatedly, that was a positive sign.
The former Reds source notes that OFP wasn’t something that dictated the team’s decisions. It was one data point among many the front office could consult. “I don’t think we had great internal information to work with, but we were using all the other available info out there to inform these decisions,” the source says. “It wasn’t like we were printing out ordered lists of prospects by OFP and drafting them that way.”
One point that might be apparent from those charts is that there aren’t any OFP grades at the bottom end of the 20-80 scale. As the source explains, “We stupidly didn’t insist that scouts write up the guys scouts didn’t like, so if a cross-checker went to see one of his [area scout’s] players and didn’t like him, he just wouldn’t bother writing a report.” That decision may have saved scouts the efforts of writing up hundreds of perceived non-prospects who never panned out, but one scout’s non-prospect is another scout’s late-round draft recommendation. Not having a more comprehensive record of scouts’ opinions, both positive and negative, the source says, “made it very difficult to evaluate our scouts.”
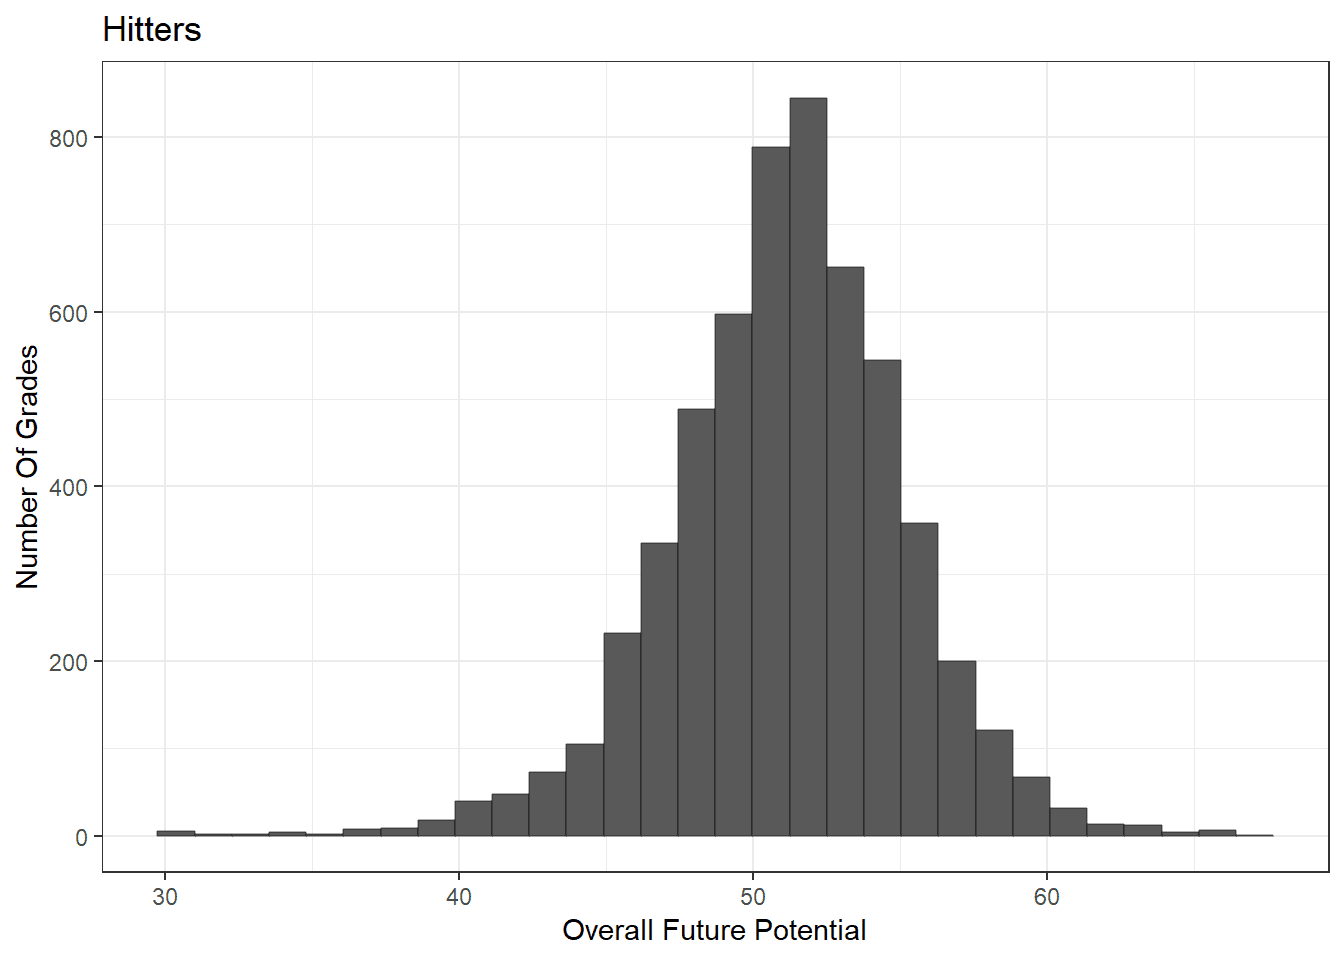
Another analytical complication came from a clear compression—and arguably a misuse—of the scouting scale. Going back to Branch Rickey, who’s credited with inventing the scale, the theoretical framework was that a difference of 10 points would represent one standard deviation, thus allowing scouts to rate anyone within three standard deviations of the mean, which would account for 99.7 percent of the population in a normal distribution. If the Reds’ reports followed that blueprint, then in the thousands of scouting reports in the sample, hundreds should have fallen more than one standard deviation above average, dozens more than two, and a few around three deviations above average, equating to an 80 on the scale.
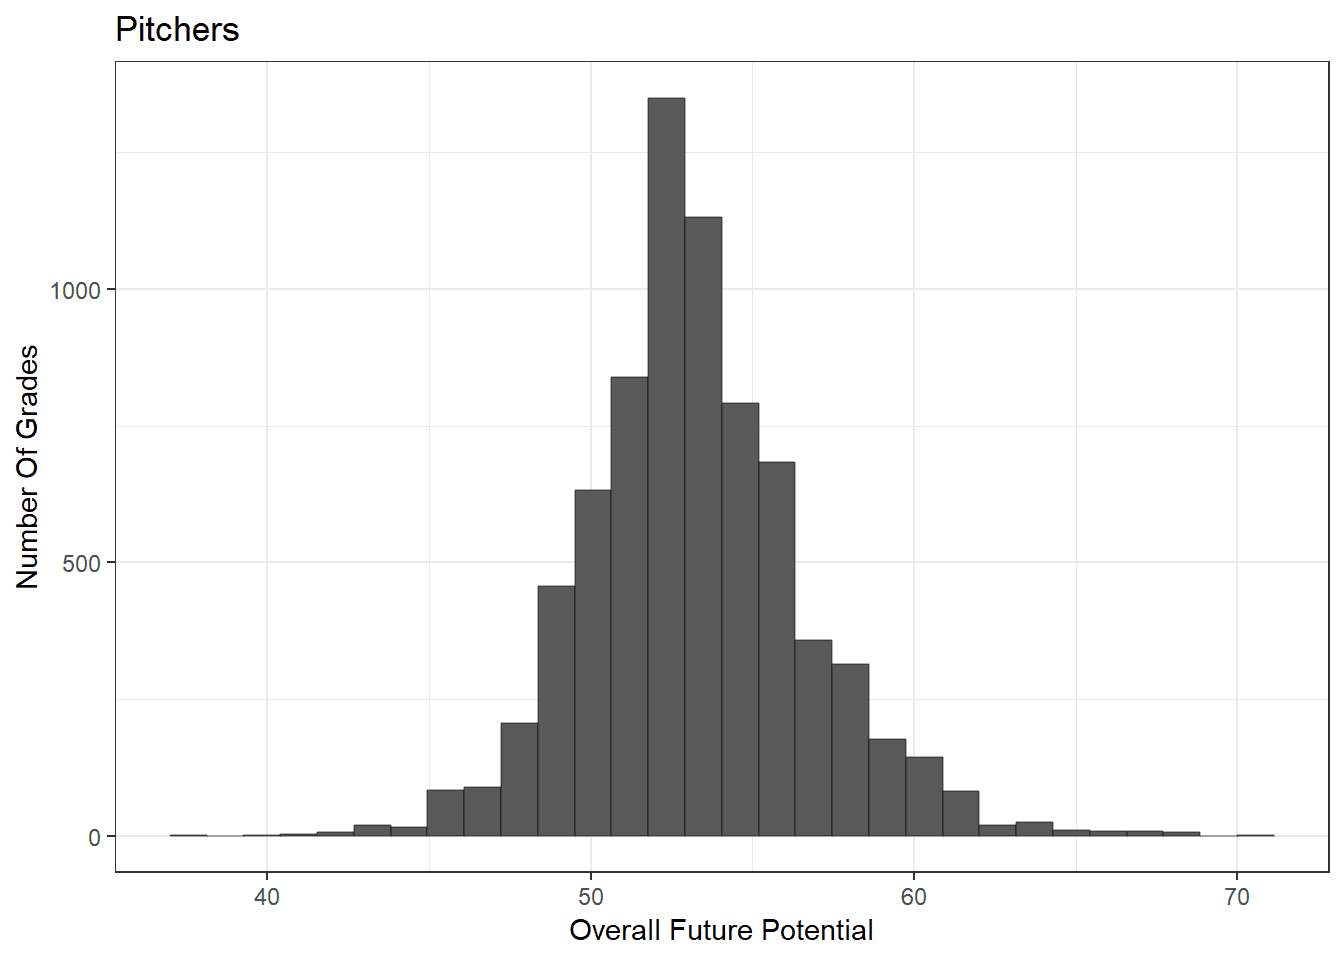
In practice, though, that wasn’t the case. Only 1.2 percent of hitters and 2.6 percent of pitchers were rated higher than a 60 in OFP, whereas in the top half of a true normal distribution we would expect approximately 15 percent of players to be rated that highly. No Reds scout in the sample assigned an amateur player an OFP above 70, which we would expect to see for about 2 percent of reports, equating to more than 200 in a data set of this size.
The same grade compression was evident in other components of hitter and pitcher performance. Only a few dozen hitters rated above a 60 in the hit power grade. (More rated above 60 in future hit power, but still not as many as one would expect based on a normal curve.) The same went for fielding ability in hitters, fastball velocity in pitchers, etc. The scouts compressed virtually every grade. Worse still, some scouts graded in increments of five or 10, while others worked with more granular numbers. A 53 for one scout might be comparable to a 55 for another who rounded to the nearest five, or a 50 for another who rounded to the nearest 10.
“The grade compression thing was a huge pet peeve of mine,” the source says, alluding to one scout whose reluctance to explore the scouting-scale space was notorious internally. “He would tell everyone how much he loved some hitter, then I’d look at the reports and see that he gave him 55 hit and 55 power grades.”
This tendency in the data set is easy to see if we graph all of the hitter and pitcher OFP grades and observe how they huddle in the center of the scale.
This problem wasn’t specific to the Reds. In 2017, Astros GM Jeff Luhnow told New York Times writer Tyler Kepner that when he began working in the Cardinals’ scouting department in 2003, he was “bewildered” to learn that “few scouts seemed to go outside the 45 to 55 range, meaning too many prospects were clustered in the middle.” Kepner, who also cites other examples from the industry of scouts acting hesitant to award extreme grades, quotes Luhnow as saying, “I realize you can’t fight City Hall, and people have been so indoctrinated in this method of thinking about players that you have to accept it and work with it.”
This effect is particularly pronounced in the amateur reports; the further from the majors a player is, the bigger the error bars around scouts’ forecasted career outcomes, and the harder it is to pronounce players future stars. But the pattern persists in the pro reports, which don’t include OFPs. In most tools—even those that clearly follow normal distributions in the majors, such as fastball velocity—only about 1-2 percent of pro prospects earned grades of 60 or above. The difference in the pro reports is that a smattering of 70s and even 80s exists, although they’re reserved for exclusive company; 70s in hit power, for instance, went to the era’s elite luminaries, like Griffey, Barry Bonds, Manny Ramírez, and Alex Rodriguez. (If you’re wondering whether the scouts were concerned about steroids, they don’t appear to have been; steroid-era physical descriptions of Barry Bonds, Sammy Sosa, and other muscle-bound sluggers evince no obvious suspicions, and the word “steroid” appears only twice in the database, in descriptions of two players who haven’t been concretely linked to PED use. A 1998 comment invokes Brady Anderson’s “Medium muscled steroid body frame,” and a 1999 description references career minor leaguer Mike Glendenning’s “steroid looking type structure.”)
Keith Law, who began covering prospects for Baseball Prospectus in 1997, went on to work in the Blue Jays’ front office from 2002 to 2006, and has since written about prospects for ESPN, says, “There’s an inherent conservatism, particularly on the amateur side.” He adds, “You’re essentially sticking your neck out. If you say so-and-so is a 60 hit tool as an amateur player, you’re taking a risk. You look particularly bad if he gets to pro ball and he just can’t hit at all.” It’s safer to hedge, particularly about aspects of performance where there’s no objective measure to go by—which are increasingly scarce today, as we’ll explore in Part 3 of this series. “Speed was always one where it seemed like people would use the whole scale, because it’s off the stopwatch,” Law says. “Eighty speed is 80 speed. There’s not an argument over that.”
Scout Consistency, Scout Variation, and Qualitative Ratings
In September 1993, a Reds scout saw a young Derek Jeter and came away impressed. “Good looking SS, very young but he handles himself very well, plays hard and has a good future,” he wrote. “Improved with bat from start to finish.” The next November, another Reds scout saw a slightly older Jeter in the Arizona Fall League and filed the scouting equivalent of a shrug combined with a yawn. “Showed no above average tool. Arm was below. Power below. Maybe was hurt. Don’t know.” Whether because of personal preferences or because they see players do different things, professional talent evaluators don’t always come close to agreeing about any given player’s future, even when they see him at almost the same time.
On the whole, the Reds’ scouts did show some agreement when evaluating prospects. On average, any two scouts pegged a given amateur prospect to within 2.7 points of OFP in different reports, compared with an average difference between any randomly selected pair of players of about 3.8 points (because of the aforementioned compression of the scale). Even so, the intraclass correlations between pairs of scouts assessing the same amateur prospect was only 0.15 for pitchers’ OFP grades and 0.24 for hitters’. Both of these figures are significant, but the relationships are weak.
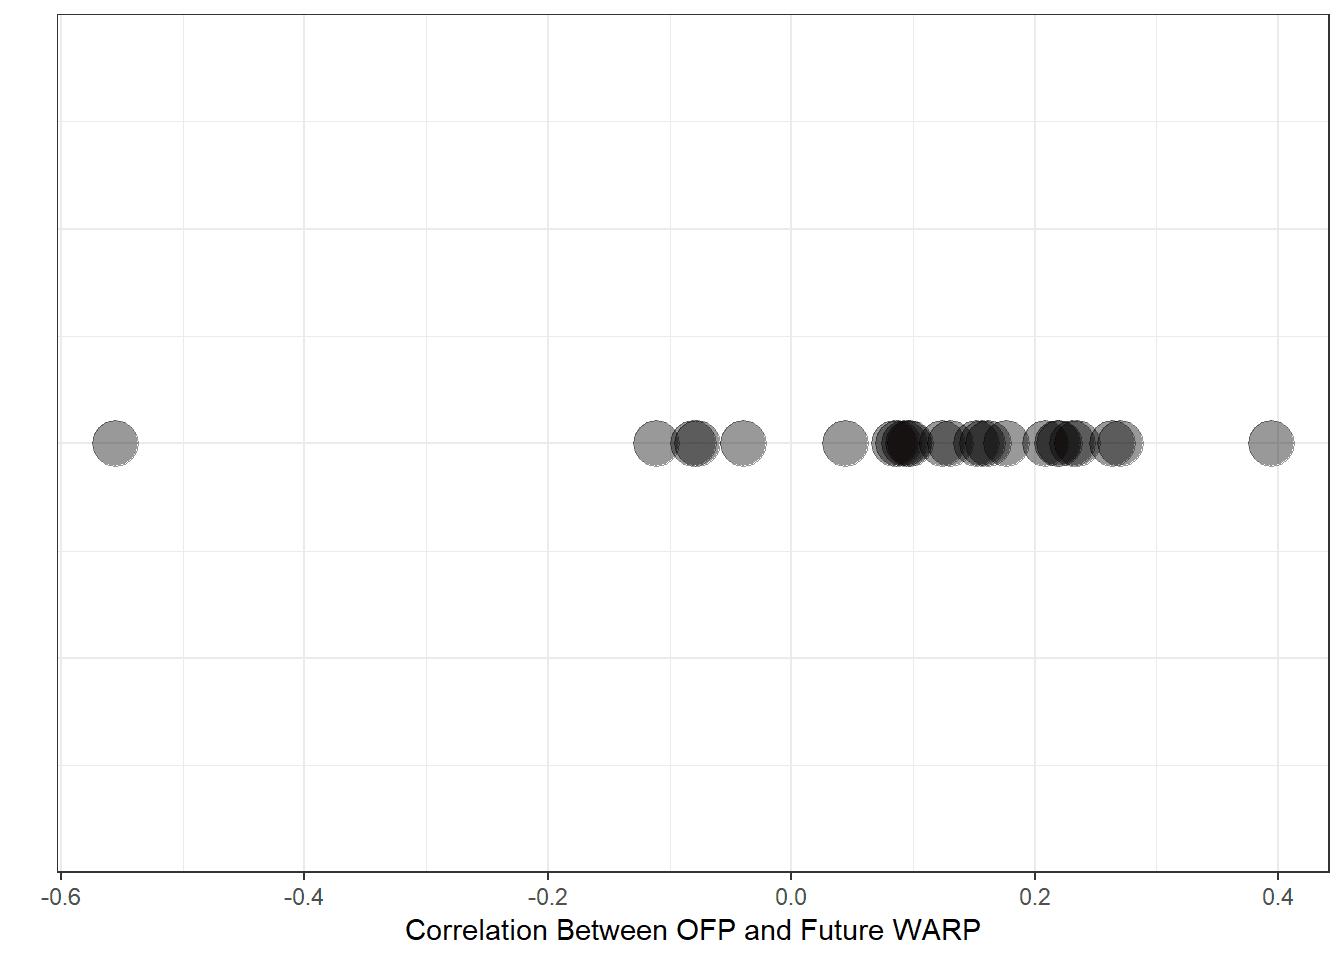
As one would expect given the inconsistency of evaluations, accuracy varied widely among individual scouts. On the high end, some scouts showed correlations from 0.2 to 0.4 between OFP and career WARP. Most were significantly below that and no better than random chance. One scout was so bad at grading pitchers that his evaluations were actually significantly negatively correlated with pitcher WARP—the worse he thought they would be, the better they actually were. The chart below shows the broad disparity between prolific scouts in terms of the correlation between the OFPs they assigned amateur hitters and those players’ actual outcomes.
There were also systematic stylistic differences between individual scouts, some of whom were hard graders and some of whom were more likely to hand out higher numbers. Some scouts had average grades up to five points higher than others, which is saying something considering how closely most of them hewed toward the center of the scale. And some were more willing to spread out on the scale, with the standard deviation of OFPs—a measure of how closely clustered the grades were around each scout’s personal average—ranging from four points to 10 among prolific report-writers. Law recalls, “I remember we had a guy who was notorious for this: He would have above-average grades on guys and say he wanted to draft them in the 20th to 30th rounds. If you think he’s an average big leaguer, he’s not still on the board.”
Unsurprisingly, given amateur players’ distance from the majors, scouts’ grades on pro reports tended to show a closer connection to career outcomes. Among hitters, the hit ability grade on pro reports had a 0.27 correlation with career WARP, higher than any single component (or the OFP grade) on the amateur reports. Similarly, individual pitch grades for pro pitchers correlated relatively well with career WARP. A pro pitcher’s fastball and curveball grades predicted his career WARP with a correlation of 0.28. Edgar Martinez, Alex Rodriguez, Larry Walker, Todd Helton, Nomar Garciaparra, and Jeter received some of the highest hit ability grades in the sample; among pitchers, Pedro Martínez excelled in fastball life, Martínez and Barry Zito received sterling curveball grades, Roy Halladay, Randy Johnson, John Smoltz, and Mike Mussina drew attention for their sliders, and Bartolo Colon earned top marks for fastball velo. Ironically, the Reds’ first report on Colon, from September 1994, lamented the 21-year-old’s lack of consistency in the strike zone; even more ironically, a 1997 report on Colon warned, “Can’t get by on FB only.”
Both amateur and pro reports contain a few fields that go beyond the standard skills and tools. Pro hitter reports contain a “hit style” that encapsulates each player’s approach at the plate.
“Hit Style” and Career Outcomes
Pro pitcher reports, meanwhile, contain a field called “arm action” that sums up each pitcher’s mechanics.
Pitcher Arm Actions and WARP
These grades did prove significantly predictive, and in much the way one would think: power and line-drive hitters panned out the best, as did pitchers with smooth arm actions. Mechanics may be complex, but they weren’t a complete mystery.
Other atypical categories didn’t prove as illuminating. “Aggression,” for instance, was a one-word label for a player’s demeanor or attitude, a component of makeup. Aggression ratings weren’t even slightly indicative of future production, and many of the outcomes ran contrary to what one would expect: “Timid” pitchers did better than “battlers,” and “careless” pitchers ended up above average.
Pitcher Aggression Ratings
Hitter Aggression Ratings
Judging makeup is one of the ways in which a scout can add value, which was true in the 1990s and remains true today. But plumbing the depths of a player’s soul isn’t necessarily simpler than assessing his capacity for spinning a slider. “You want to know that the kid wants the ball, and that when there’s some adversity, that he’s not going to change his demeanor, certainly,” Law says. But, he adds, “I think the problem with those has always been nebulous definitions.”
That’s not the only problem. When making inferences or drawing conclusions about makeup, scouts must often rely on observations from afar or second- or third-hand character references (or assassinations). Many reports in the Reds database pass on rumors or reports about players’ personalities or private lives that seem to rely on sneakers-on-the-ground information-gathering; others, more dubiously, reference body language during batting practice. Just as people make positive impressions on certain companions and negative impressions on others in nonathletic life, some players are perceived differently depending on the scout. To make matters more difficult, cortical development in late adolescence alone ensures that young players mature mentally and emotionally in ways that can’t be observed directly.
In September 1993, one Reds scout wrote of 28-year-old Rockies infielder Charlie Hayes, “Has a lot of ability but poor makeup. Refuses to play hard or work hard.” The same month, a second Reds scout echoed, “Lazy guy that doesn’t always play hard but he can field and hit. … Don’t like his makeup but like his ability.” Yet in August 1998, a third scout who saw Hayes, who was then with the Giants, wrote, “6-0, 230 pound bundle of JOY. Great attitude and makeup. Loves to play the game.” Maybe Hayes changed, or maybe different scouts had different subjective experiences.
It’s also impossible to read comments like “Too much ear rings and gold chains” about Rubén Sierra or (from a separate scout) “Even with ear rings and high tops, he can swing the bat” about Barry Bonds without strongly suspecting some scouts of bias based on players’ appearance, background, or race (which other studies have seemed to detect in the broadcast booth). Using a database of demographic data about baseball players collected and supplied to us by SABR researchers Mark Armour and Daniel Levitt, we searched for signs of racial bias in the labels applied to players in the “aggression” field.
Indeed, the evidence does support the idea that race affected how some scouts perceived some players. Among amateurs, only 1.5 percent of white hitters were classified as possessing “questionable” aggression, but 3.3 percent of nonwhite hitters received “questionable” classifications, with an additional 1 percent receiving the tag “must show more.” 4.8 percent of nonwhite pitchers were called “careless,” compared with 0.9 percent of white pitchers. Among pro hitters, nonwhite players received a “questionable” rating at about twice the rate of white players. Nonwhite players were never described as “hard-nosed” and were less likely to be described as hard workers, good workers, or putting forth a good effort. 2.3 percent of nonwhite pro pitchers were called “careless,” compared with 1.3 percent of white pro pitchers. The disparities aren’t severe, but they point in a consistent direction.
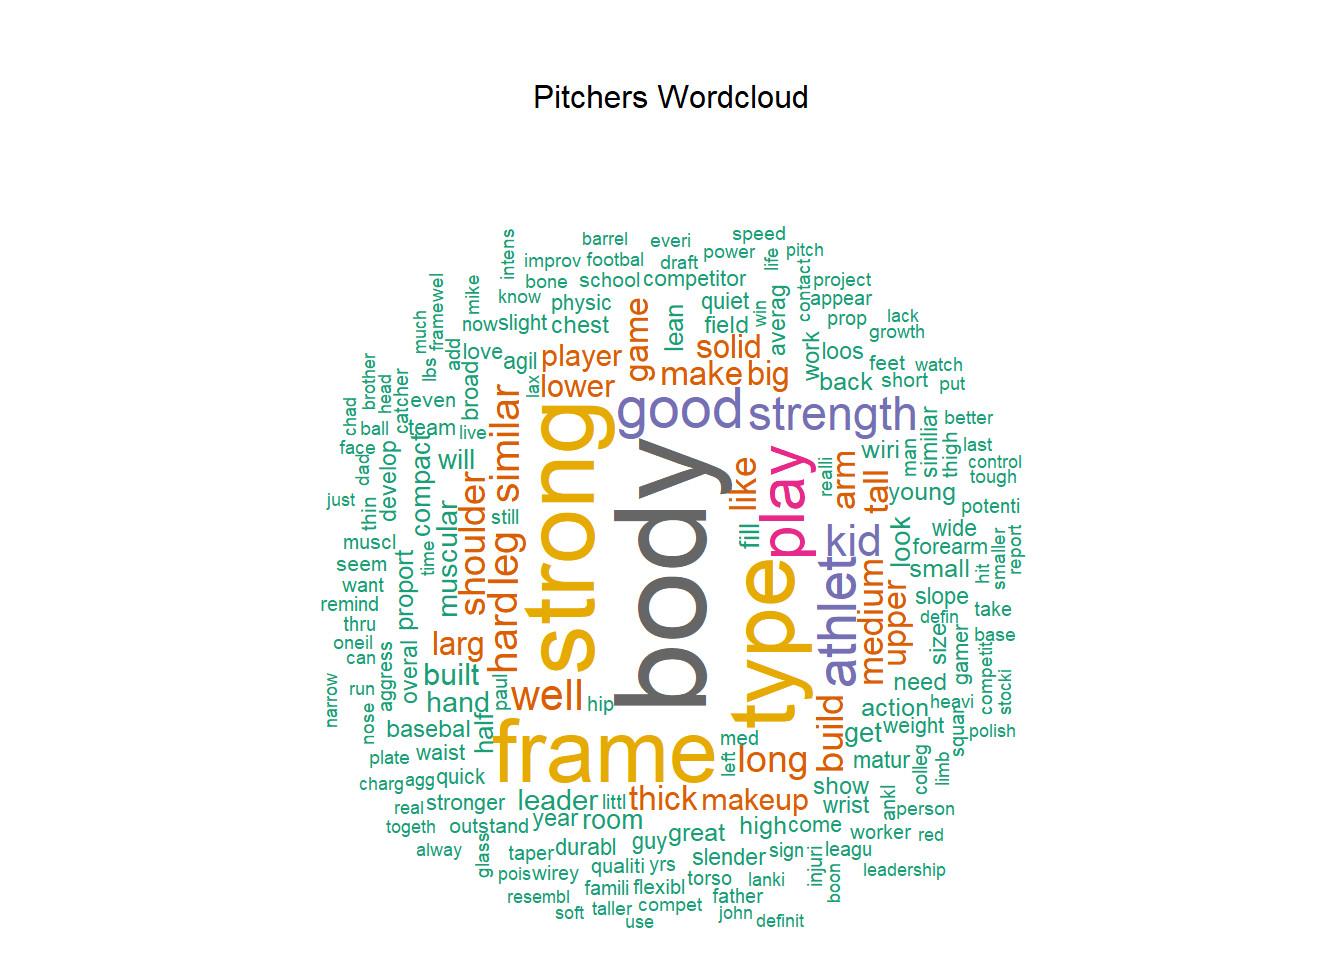
Occasional coded language and earrings rants notwithstanding, the database’s text fields are potential sources of insight that could go beyond the grades and one-word labels. “If a scout’s a little bit more of an independent thinker, you can really get more out of the free text at the bottom than you’re getting from the numbers at the top,” Law says. “The text at the bottom is where, also, a scout can give you more of a sense of, does he actually like the player? Does he want the player?”
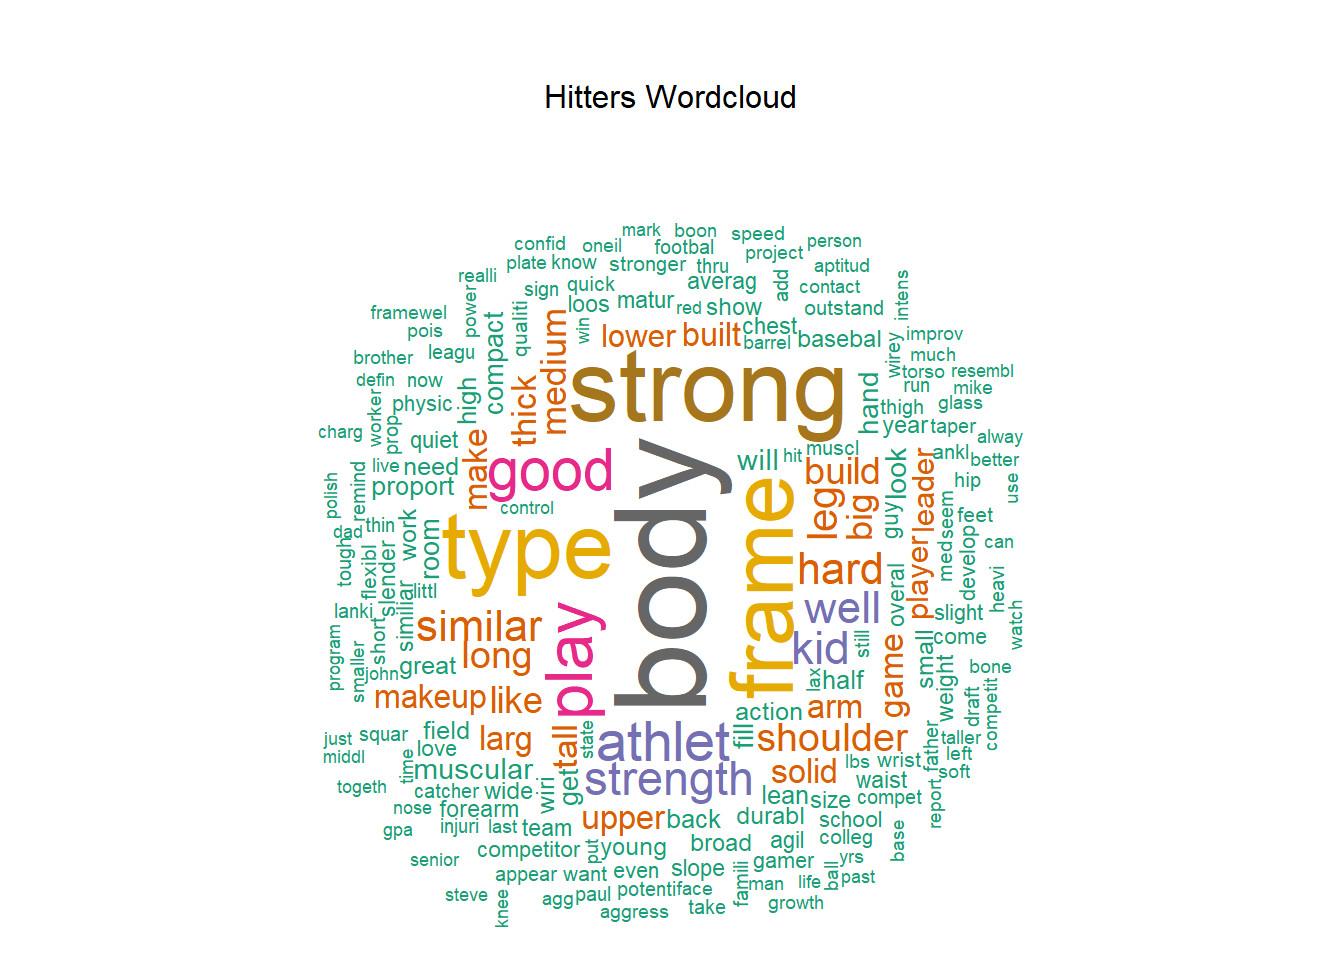
The word clouds below display the most common words scouts used to describe hitters and pitchers, omitting common words like “it” and “the.”
We also created comparison word clouds for both hitters and pitchers. This version color-codes the displays based on career outcome: Green text denotes words used most often to describe players who produced at least five MLB WARP, while orange text is reserved for players who never made the majors.
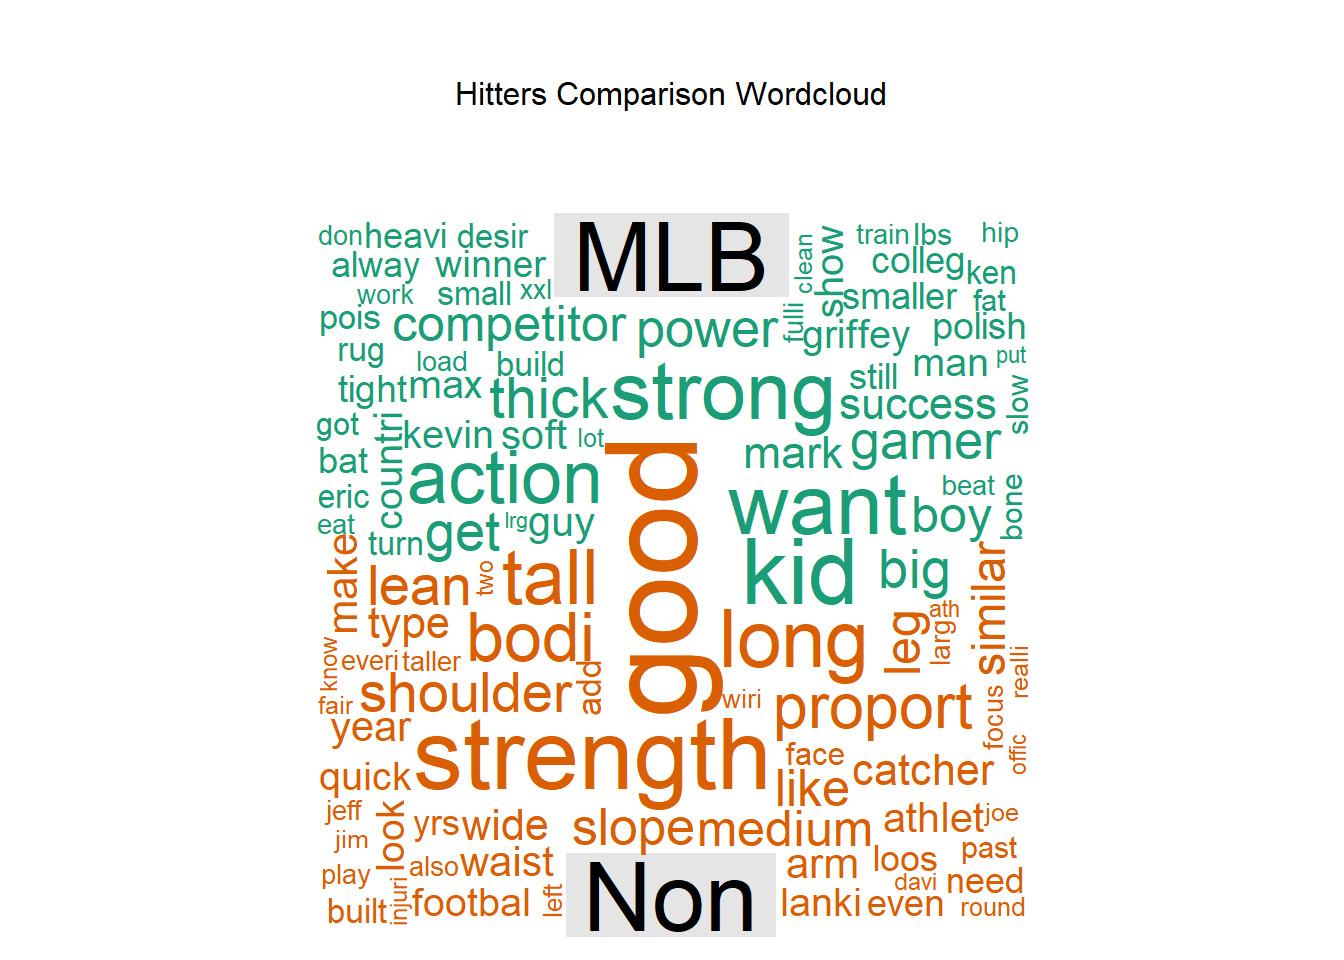

In an effort to siphon some signal from the noise, we performed a sentiment analysis using tags from the Harvard-IV dictionary, in which words are assigned a positive or negative valence as a means of assessing the tone of a text. The analysis didn’t detect any noteworthy connection between the use of positive words and a player’s MLB WARP total.
Public vs. Private, Reds vs. Rivals, and Velocity
Although we can’t compare the Reds’ reports with any other team’s—unless, of course, another source is feeling generous—we can see how they stack up to a contemporary public source of prospect rankings, Baseball America’s annual top 100 prospects lists, which date back to 1990. Because the Reds’ pro reports didn’t include OFPs, we averaged the responses in the “ProsAcq” field—a yes/no judgement of whether a scout recommended acquiring a player—to get a sense of how highly a player was valued. Then we compared that rating to his ranking by BA.
Overall, there was a moderate to weak correlation between the Reds’ player evaluations and the public-domain Baseball America lists. Generally, players with higher ProsAcq scores were also ranked higher on BA’s lists, but the correlation was weak (r = .16). There was very strong agreement on BA’s top 10 prospects, who were almost universally rated positively by Reds scouts, but there was little difference in the Reds’ ratings between BA’s prospects from 11-50 and from 51-100. Being ranked at all compared with not showing up on a BA list, however, was quite informative. Among players who appeared in both sources, the correlation between the Reds’ grades vs. future WARP was indistinguishable from the correlation between BA rank and future WARP.
“I would guess that’s probably pretty typical that you would find the discrepancy, that we would tend to agree pretty closely up top and that the discrepancy would grow as you move further down the list,” Law says. Marcos speculates that the discrepancies between teams’ internal lists have decreased as easily obtainable information about prospects has proliferated. “It might be closer today than it was years ago because we’re scouting high school players during the summer, mostly at showcases and the big events,” he says. “So every club knows about ’em. And at the college level, with all the advent of technology and video and television and whatever you have, the secrets aren’t as big. So you’re not gonna have players kinda sneak up into a team’s top 20, 30, whereas they might have years ago.”
We also investigated whether the Reds’ pro scouts were better at projecting the futures of the players on their own minor-league rosters from Single-A ball to Triple-A, or the futures of other organizations’ prospects at the same levels. For hitters, we calculated the correlations between hit ability/power and future WARP, and for pitchers, we calculated the relationships with future WARP using fastball velocity, curveball and slider grades, and a regression of all three pitches combined. The correlations were much higher for Reds players than non-Reds players. In other words, Reds scouts were significantly better at evaluating Reds players than their rivals’ players. This finding supports the results of previous studies that have hinted at an advantage to greater familiarity.
Informed of this finding, Law expressed surprise, saying, “My sense is everyone loves their own players too much.” He cites an example from December 2005, when the Blue Jays traded Miguel Batista and Orlando Hudson to the Diamondbacks for Troy Glaus. “We were getting a prospect back [Sergio Santos], and Arizona said, ‘You can’t have any of our top nine prospects.’ Like, either you have the best farm system in baseball, maybe in the last 10 years, or you’re overvaluing your eighth-best prospect.”
Law acknowledges, though, that the teams he talks to today may embellish their reports on their own players in hopes of influencing his public prospect rankings. In the Reds’ case, at least, any tendency toward an endowment effect–driven overvaluing of their own players was seemingly outweighed by the benefits of inside info or extended exposure. “It could be partly due to their being more familiar with the players, because maybe the pro scouts did have a chance to see them more than when they’re scouting another organization,” Marcos says. “When scouts scout another organization’s Double-A, Triple-A, A-ball team, they’re going out and they’re typically gonna see that club for four or five days and they’re done with them.”
One final finding pertains to fastball velocity. We know that the game’s average fastball velocity has risen dramatically since the early 2000s, but public pitch-speed data of any kind extends back only to 2002. Using the velocity readings reported by the Reds’ scouts, though, we can see that the speed increase likely began before that, although this was also a period when some scouts switched from radar guns that captured speed at home plate to guns that took readings closer to the ball’s release. The graph below shows the database’s yearly average minimum and maximum pro velocities from 1991 to 2003, as well as its yearly average max amateur velos from 1998 to 2003.

In addition to the fact that velocity increased over this time frame, some evidence suggests that Reds scouts also began to prioritize velocity to a greater degree. The correlation between max velocity and amateur OFP was strong throughout the years covered by the data, but it appeared to get stronger in the later years. Similarly, pro reports always showed a significant difference in average fastball velocity between players the Reds were interested in and those they weren’t (as indicated by the “ProsAcq” field). As the years went on, though, their preference for velocity increased, with the average velocities of players their scouts wanted to acquire leaping from 90 to 91 mph in the early 1990s up to 93 by the early 2000s. Asked whether this finding jibes with his understanding of the evolution in scouts’ preferences over that span, Marcos answers, “Absolutely.” The seeds of today’s strikeout explosion were planted long ago.
Law notes that the pace of change in late-20th-century scouting was slow. “I’d be surprised if the [Reds] form changed at all, because, certainly when I got to Toronto, those forms looked like they’d been used since the ’70s. The five tools didn’t change. The things we were asking to evaluate on pitchers hadn’t really changed, either. The fields were pretty constrained, and we weren’t actually asking [scouts] to get that much specific information that we could work with.”
Sure enough, the Reds’ reports format doesn’t appear to have been modified in any noticeable way between 1991 and 2003. But a belated evolution was on its way. We’ll cover how far things have come over the past 15-plus years in the third installment of this series. But next time, we’ll trace the career paths of players whose fates diverged from their forecasts, and we’ll seek the counsel of the Reds’ most exemplary scout.
Rob Arthur is a Chicago-based freelance journalist and data-science consultant. He currently works for an MLB team. Russell Carleton also assisted on research for this piece.
