Ever since 1986, when MLB’s non-waiver trade deadline shifted from mid-June to late July, July 31 has been a singularly busy day on baseball’s calendar. On a graph of trade activity by calendar day, the 31st’s accumulated trade total looms like the Burj Khalifa in the downtown Dubai skyline.
This week was no exception: Rumors and announcements were thick throughout deadline day, and news of just-completed trades trickled out even for several minutes after Tuesday at 4 p.m. ET, when teams were forced to lay down their pencils. Aside from the Nationals’ dalliance with dealing Bryce Harper, this year’s market lacked superstars after Orioles infielder Manny Machado went to the Dodgers two weeks ago, but the trade activity didn’t tail off just because the individual talent on offer wasn’t quite as eye-catching as it has been in some seasons. In fact, every team in the majors made a trade this July, and the month’s total activity continued a trend toward more trades—and, in particular, more trades for relievers—that has significantly enlivened the sport’s most intense trading period in the past few years.
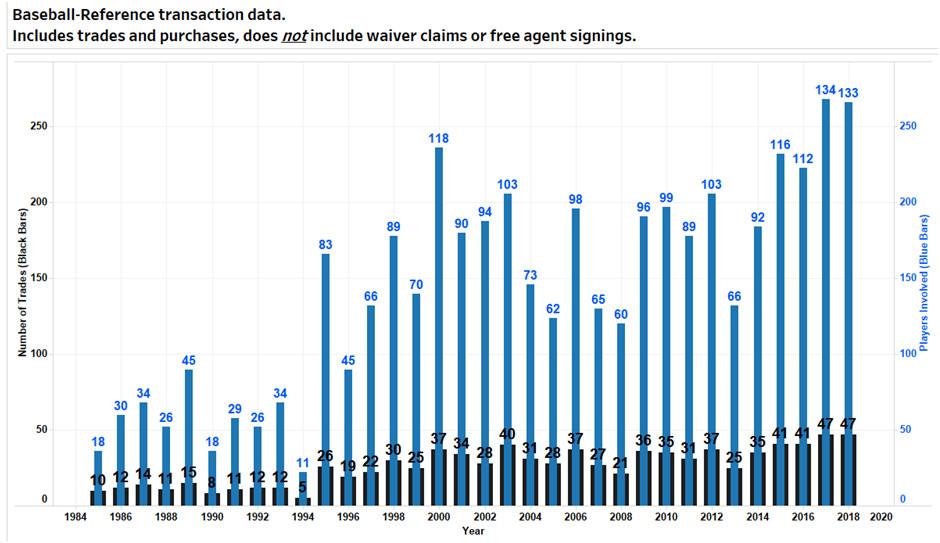
The graph below, created by baseball analyst and author Scott Lindholm based on Baseball-Reference data, displays the number of trades and player purchases made, and the number of players involved in those trades or purchases, in July of each season (plus August 1, if the deadline was that day) dating back to the mid-1980s. The entries for this year and last year show nearly identical—and previously unsurpassed—activity.

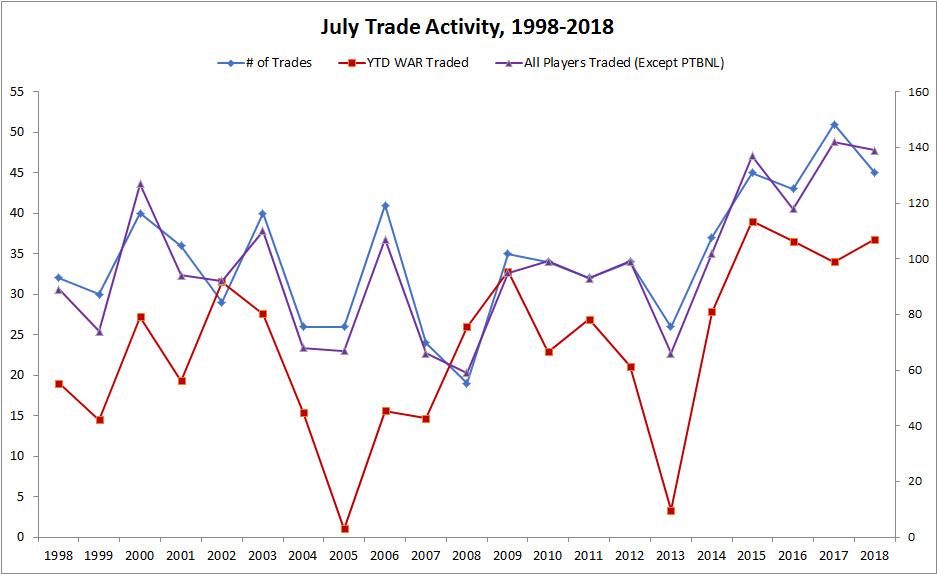
In early August 2015, I noted that the preceding July had featured a historic amount of trade activity, highlighted by swaps involving high-profile players such as Troy Tulowitzki, Johnny Cueto, David Price, Ben Zobrist, Yoenis Céspedes, and Cole Hamels (who was traded this July, too). As it turns out, though, 2015 was less of an outlier than the start of a trend. The graph below, based on Baseball-Reference data provided by Dan Hirsch (the proprietor of historical stats and analysis site The Baseball Gauge), shows that July’s number of trades completed, number of players changing teams (excluding players to be named later), and collective year-to-date WAR produced by the big leaguers among those players prior to their trades have all roughly held steady or even increased in the three deadlines since, easily exceeding most or all of the earlier seasons in the 30-team era.

This year, every division except the AL Central is still conceivably in play, which gave several potential buyers a real reason to reload leading up to the deadline. In addition, this season’s (and last season’s) unusually stratified superteam structure has created a near-perfect numerical match between the needs and the need-nots: As play begins on Wednesday, 13 teams have less than a 2 percent chance of making the playoffs, and 16 teams are below double digits.
Of course, some of the recent increase in trade activity could be a byproduct of a change that predated the big gap between baseball’s best and worst teams since the start of last season: MLB’s 2012 adoption of a second wild card in each league, which has reduced the average non-playoff team’s distance to the closest playoff spot. Thanks to the 10-team playoff format, more clubs can dream in late July about playing meaningful games in September and appearing in the postseason the following month. In this year’s imbalanced American League, only two teams are truly in the running for the second wild card, but the National League is a free-for-all; at the end of this year’s deadline day, three teams were tied for the NL’s second spot, and four other teams trailed those leaders by five or fewer games. A team in wild-card contention might not be willing to make a major move in pursuit of a prize that could be no better than one playoff game (which could come on the road), but it does have incentive to do something, and those somethings add up.
In an increasing number of cases, the moves made in July involve relief pitchers. The following graph, again derived from Baseball-Reference data provided by Hirsch, shows the number of relievers traded each July, the collective WAR they’d produced prior to the deals, and the percentage of all traded MLB players that those relievers represented. For the purposes of this chart, we defined relievers as pitchers who’d made at least 90 percent of their same-season appearances out of the pen.

From 1986 (not pictured) through 2016, relief pitchers accounted for 30 percent of all major leaguers traded in July. In the past two seasons, that figure has climbed to 48 percent: Nearly half of all MLB players dealt at the past two deadlines have been relievers. As my colleague Zach Kram wrote last year in noting the advent of this phenomenon, “Just about the only relievers on the market who weren’t dealt were Padres lefty Brad Hand … and Orioles lefty Zach Britton.” Both of those pitchers were traded this July, along with a whole host of others. Of the 13 teams with the highest playoff odds today, only the Red Sox didn’t trade for a reliever last month, and the Sox were reportedly deep in discussions with the Nationals about acquiring Kelvin Herrera (who has already been traded once this season).
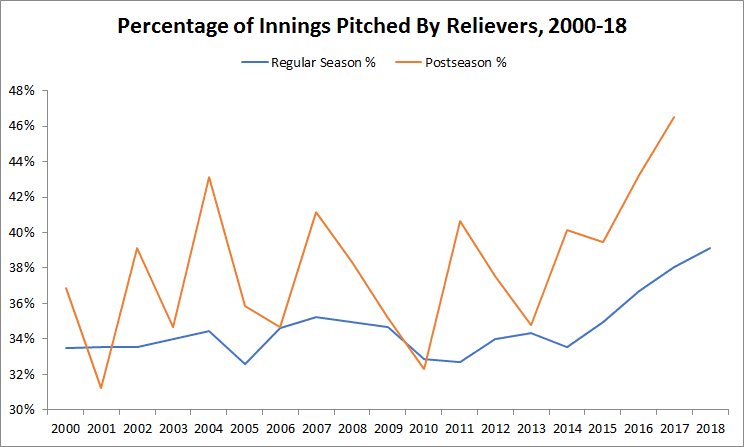
Granted, as bullpens have expanded, relievers have made up a larger portion of the overall MLB player pool. But this dramatic, recent rise stems from something else: a revolution in October bullpen usage. In 2016, the Indians made it to Game 7 of the World Series despite a short-handed starting rotation partly by riding the Andrew Miller–led bullpen that they’d reshaped by trading for Miller midway through the year. As the lefty’s long outings and other unorthodox bullpen tactics became the story of that postseason, teams paid attention. The following spring, baseball watchers were on the lookout for Miller clones, and to a certain extent teams have begun to take tentative steps away from the one-inning-only model that has held sway over relievers in the regular season for some time. But the real innovation arrives in off-day-filled October, when managers are increasingly following 2016 Terry Francona’s lead by subbing setup men for starting pitchers before the starters suffer from facing hitters more than two times in a game. Although the percentage of innings pitched by relievers in the regular season has risen rapidly, the increase in October is even steeper.

Last October, relievers pitched an unprecedented 46.5 percent of postseason innings, and, judging by recent developments, that number could climb again this year. Thus, teams are scrambling for solid relievers in July, often less with an eye toward making the playoffs than toward doing damage once they’re there.
It may or may not be the best thing for baseball that the “bullpen game” has become the way to win in October: More lights-out relievers means more pitching changes, less offense and, perhaps, a greater disparity in the sport as it’s played in the regular season and during the month when the games matter most. But for better or worse, the age of ascendant October pens is upon us, and teams are trying hard in the summer to squirrel away arms for the fall. And thanks to that trend, plus the expanded playoff format and the prevailing, lopsided competitive picture, the trade deadline has never been busier.
