On the eve of Opening Day, one frequent refrain about Major League Baseball lamented that the league’s regular season seemed all but decided before it began. The sport was awash with superteams and tanking teams, and the small class of could-be competitors teetering between the two camps didn’t appear up to the task of keeping fans invested for 162 games. Not enough clubs were poised to contend.
Then a funny thing happened: The season didn’t start the way it was supposed to. As late as April 19, not one of the sport’s six preseason-projected division favorites occupied first place. Since then, though, some order has been restored: As the second half starts, the Nationals and Yankees are the only preseason favorites that aren’t leading their respective divisions, and the Yankees—who were only slight favorites over Boston to begin with—look like locks for the top AL wild-card slot if they can’t catch up to the Red Sox.
Even so, there are plenty of spots still up in the air. The Yankees and Red Sox, Cubs and Brewers, Phillies, Braves, and Nationals, and Dodgers and Diamondbacks are all embroiled in battles for first. The only division with a margin of more than five games between the teams in first and second is the historically horrible AL Central, where the Indians—powered by a pair of slick-fielding, heavy-hitting infielders and bolstered by a Thursday trade for late-inning relief help—are up 7.5 and will soon see double digits. And thanks to Oakland’s recent surge, the run-differential-defying Mariners are only three games up in the fight for the AL’s second wild-card slot, while the NL wild-card chase is a complete cluster. That’s a formula for more intrigue than the preseason doomsayers foresaw.
There’s a stat we can use to quantify the closeness of the standings: the Hope and Faith Index (HFI), which was created by Hardball Times author Gerald Schifman after the 2016 season. The HFI measures the distance of every team that’s not currently in playoff position from the closest playoff spot then sums those differences and divides by the number of teams in the league. The higher the resulting number, the further from the playoffs the trailers tend to be. Thus far, the HFI actually aligns with worries about a non-competitive playoff race, showing a sharp spike this season compared to previous All-Star breaks in the four-wild-card era.
As Schifman observes via email, though, that increase is attributable “in no small part to the Orioles and Royals, who have the two biggest deficits at the break in the two-WC era.” As dismaying as the Orioles’ and Royals’ 30-game deficits in the wild-card race must be to Baltimore and Kansas City fans, respectively—although on the bright side, the Royals are a mere 25 back in the Central—those two scale-breaking sinkholes skew the state of the standings as expressed by the HFI. The O’s and the Royals would be equally out of it even if they were half as far from contention, so the fact that they’re as deep in the hole as a prisoner serving consecutive life sentences doesn’t have much bearing on the excitement that the stretch run has in store.
The other issue with the HFI is that a team’s distance from the closest playoff spot at midseason doesn’t always accurately reflect its odds of ending up in that spot come October. The Nationals and Pirates may both be roughly five games out of a playoff spot, but based on what we thought about the quality of those two teams coming into the season—Washington was a projected first-place finisher, while Pittsburgh was slated for fourth—they aren’t quite comparable threats. Similarly, the Dodgers are only half a game up on the Diamondbacks in the NL West, but in light of their superior roster—augmented this week by the acquisition of Manny Machado—that race seems less like a toss-up than the standings alone would suggest.
Forward-looking projections, unlike the backward-looking HFI, can account for team talent as well as what the standings say. So a better way to assess how suspenseful the second half is likely to be, compared to previous seasons that featured the current playoff format, is by consulting the Baseball Prospectus playoff odds, which are available back to 2012, when the playoff field expanded from eight to 10 teams.
There’s more than one way to evaluate a playoff race, but by most projection-based measures, this year’s race looks tighter than last year’s and not terribly out of line with those of some pre-2017 seasons. Let’s start with a snapshot of each race at the same point in each season. The chart below displays the 10 midseason playoff favorites’ odds of winning divisions or wild cards at each All-Star break since 2012. Blue diamonds represent division favorites, while red squares represent likely wild-card teams.
In some years, the plotted points are more compressed, reflecting competitive parity in the division races, wild-card races, or both. Other years feature a lot of locks, with plots pointed close to the top of the scale. At last year’s All-Star break, for instance, there were already four teams that had at least 90 percent odds of winning their divisions: the Astros, Nationals, Dodgers, and Indians, all of which wound up with titles. This year, there are only two: the Astros and Indians again.
The blue and red lines on the graph show the average odds of victory for all of each season’s division leaders and wild-card leaders, respectively, while the teal line lumps all 10 together. The takeaway: This year’s division races are less decided than last year’s and roughly on par with 2016’s, although there does seem to be a trend toward less intensely contested divisions in the past few years, maybe because teams have realized the risks of building up to confront a stacked division favorite when the loser faces the prospect of a play-in game at best. The 2018 wild-card races are less decided than last year’s and 2013’s, while the overall security of the 10 current playoff favorites is lower than last year’s and approximately in line with 2015’s and 2013’s.
The critique one could make about the 2018 playoff field is that while there’s plenty of intrigue at the top, the breadth of the battlefield is a little lacking. The graph below shows the annual number of divisions whose favorites are at least 85 percent likely to prevail, as well as the number of wild-card contenders with at least a 15 percent shot to emerge with a win. This year’s wild cards are closely contested, but the scrum of plausible victors isn’t quite as crowded as it was in most years prior to 2017.
In part, that’s because there are more teams than usual essentially sitting this season out. The graph below shows the number of teams at the All-Star break in each season that have looked like shoo-ins for some playoff position—without specifying whether it’s a division championship or a wild card—or eliminated from contention for all practical purposes.
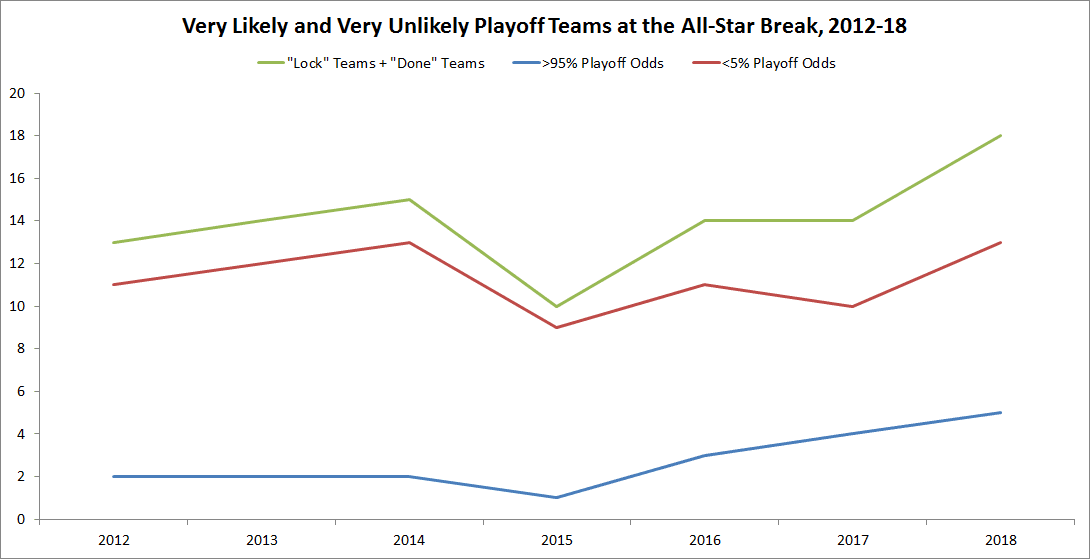
According to BP, 18 of this season’s teams have either a higher than 95 percent chance or a lower than 5 percent chance of making the playoffs one way or another. That makes this the first time in the four-wild-card era that more than half the teams at the All-Star break were already designated with near certainty as playoff or non-playoff clubs.
In other words, whether this year’s playoff races are shaping up to be bad or good depends on what one wants out of a stretch run. If the goal is to squeeze as many teams into the playoff picture as possible, this season’s second half probably won’t deliver; the teams that are out of it have made damn sure that they won’t be back in. But if the mission is to promote races that come down to the wire, 2018 is shaping up to finish a lot like multiple years in baseball’s recent past. And just like last year, we’re in for an especially strong playoff field, particularly in the top-heavy AL.
In the long run, it’s probably better for baseball from a spectator perspective to have more teams in the hunt and more fan bases engaged. (Attendance is down 5.8 percent relative to the same point last season, and the unusual number of non-competitive clubs could be one reason why.) But the current arrangement of rebuilders and superteams isn’t likely to last, if only because a teardown takes a team only so far when there’s a long line for last place. In the coming seasons, some of the superteams will slip, some of the rebuilders will blossom, and the sport will start looking less stratified. In the meantime, the quality of the races will compensate for the quantity of contenders. Yes, this season’s stretch run stands out. But that doesn’t mean that it has to be boring.