
By virtue of his being an athlete and a member of the human race, Mike Trout is fallible. He pops up meatballs, he swings and misses, he loses fly balls in the sun, and gets up on the wrong side of the bed. He’s the best baseball player alive and the best 25-and-under baseball player in a century, but he still plays a game that embraces a theme of failure, and he’s not immune to its effects.
He has, however, thus far been immune to widespread failure; struggles have afflicted just small sections of his game at a time, never—aside from his lackluster 40-game debut in 2011—metastasizing into a slump broad enough to derail a full season. In 2014, Trout rated as one of the worst defensive center fielders in the majors and led the American League in strikeouts; he also won the league’s MVP award because he hit for power, ran well, and led the league in both runs scored and runs batted in. He possesses so many diverse skills that it’s hard to imagine an across-the-board bad Trout season.
But what if we tried? What if we cherry-picked the worst component parts of past Trout seasons and combined them into one hypothetical season of struggles? What would a Frankenstein’s monster collection of Trout’s worst individual statistics look like?
Trout’s initial 2018 projection on FanGraphs calls for him to hit .299/.427/.599, club 39 homers in 651 plate appearances, steal 22 bases, and reach 8.3 wins above replacement (no other position player is above 6.4). But that projection is an average composed of a wide range of possible performances for Trout in 2018. In one timeline, as Baseball Prospectus’s Zach Crizer wrote last month, Trout would “break out” and produce a peak Bonds season. In another—the actual worst possible Trout season—he would suffer a season-ending injury leaving the batter’s box in the first inning on Opening Day.
And in our hypothetical scenario, he’d spend the whole season getting up on the wrong side of the bed, and fastening the buttons on his jersey one spot askew, and forgetting to dab sunscreen on the back of his neck before jogging around the Angel Stadium outfield. He’d be out of sorts all year long, and it would manifest in the worst on-field performance possible, based on his past results, for the best player in the sport. Using his 2018 projection as a baseline, were Mike Trout to become mortal, here’s how far he could sink.
Step 1: Worse Running, Worse Defense
Trout is an exceptional baserunner. In 2012, he succeeded on 49 of 54 stolen-base attempts while posting the most productive baserunning season of the past 16 years (as far back as FanGraphs’ metric reliably extends), and even as he’s traded some speed for power and scaled back his running exploits, he’s still excelled. His total of 45.1 runs added with his legs is second only to Billy Hamilton’s (46.1) since 2012.
But of all the areas in which Trout could regress from exceptional to merely OK in 2018, baserunning seems the most likely. His projection already forecasts a slight career worst in total baserunning value this season, and after he tore a ligament in his thumb on a stolen-base attempt last year, the Angels might prefer that he conserve his long-term health rather than try to extract every fractional run on the basepaths.
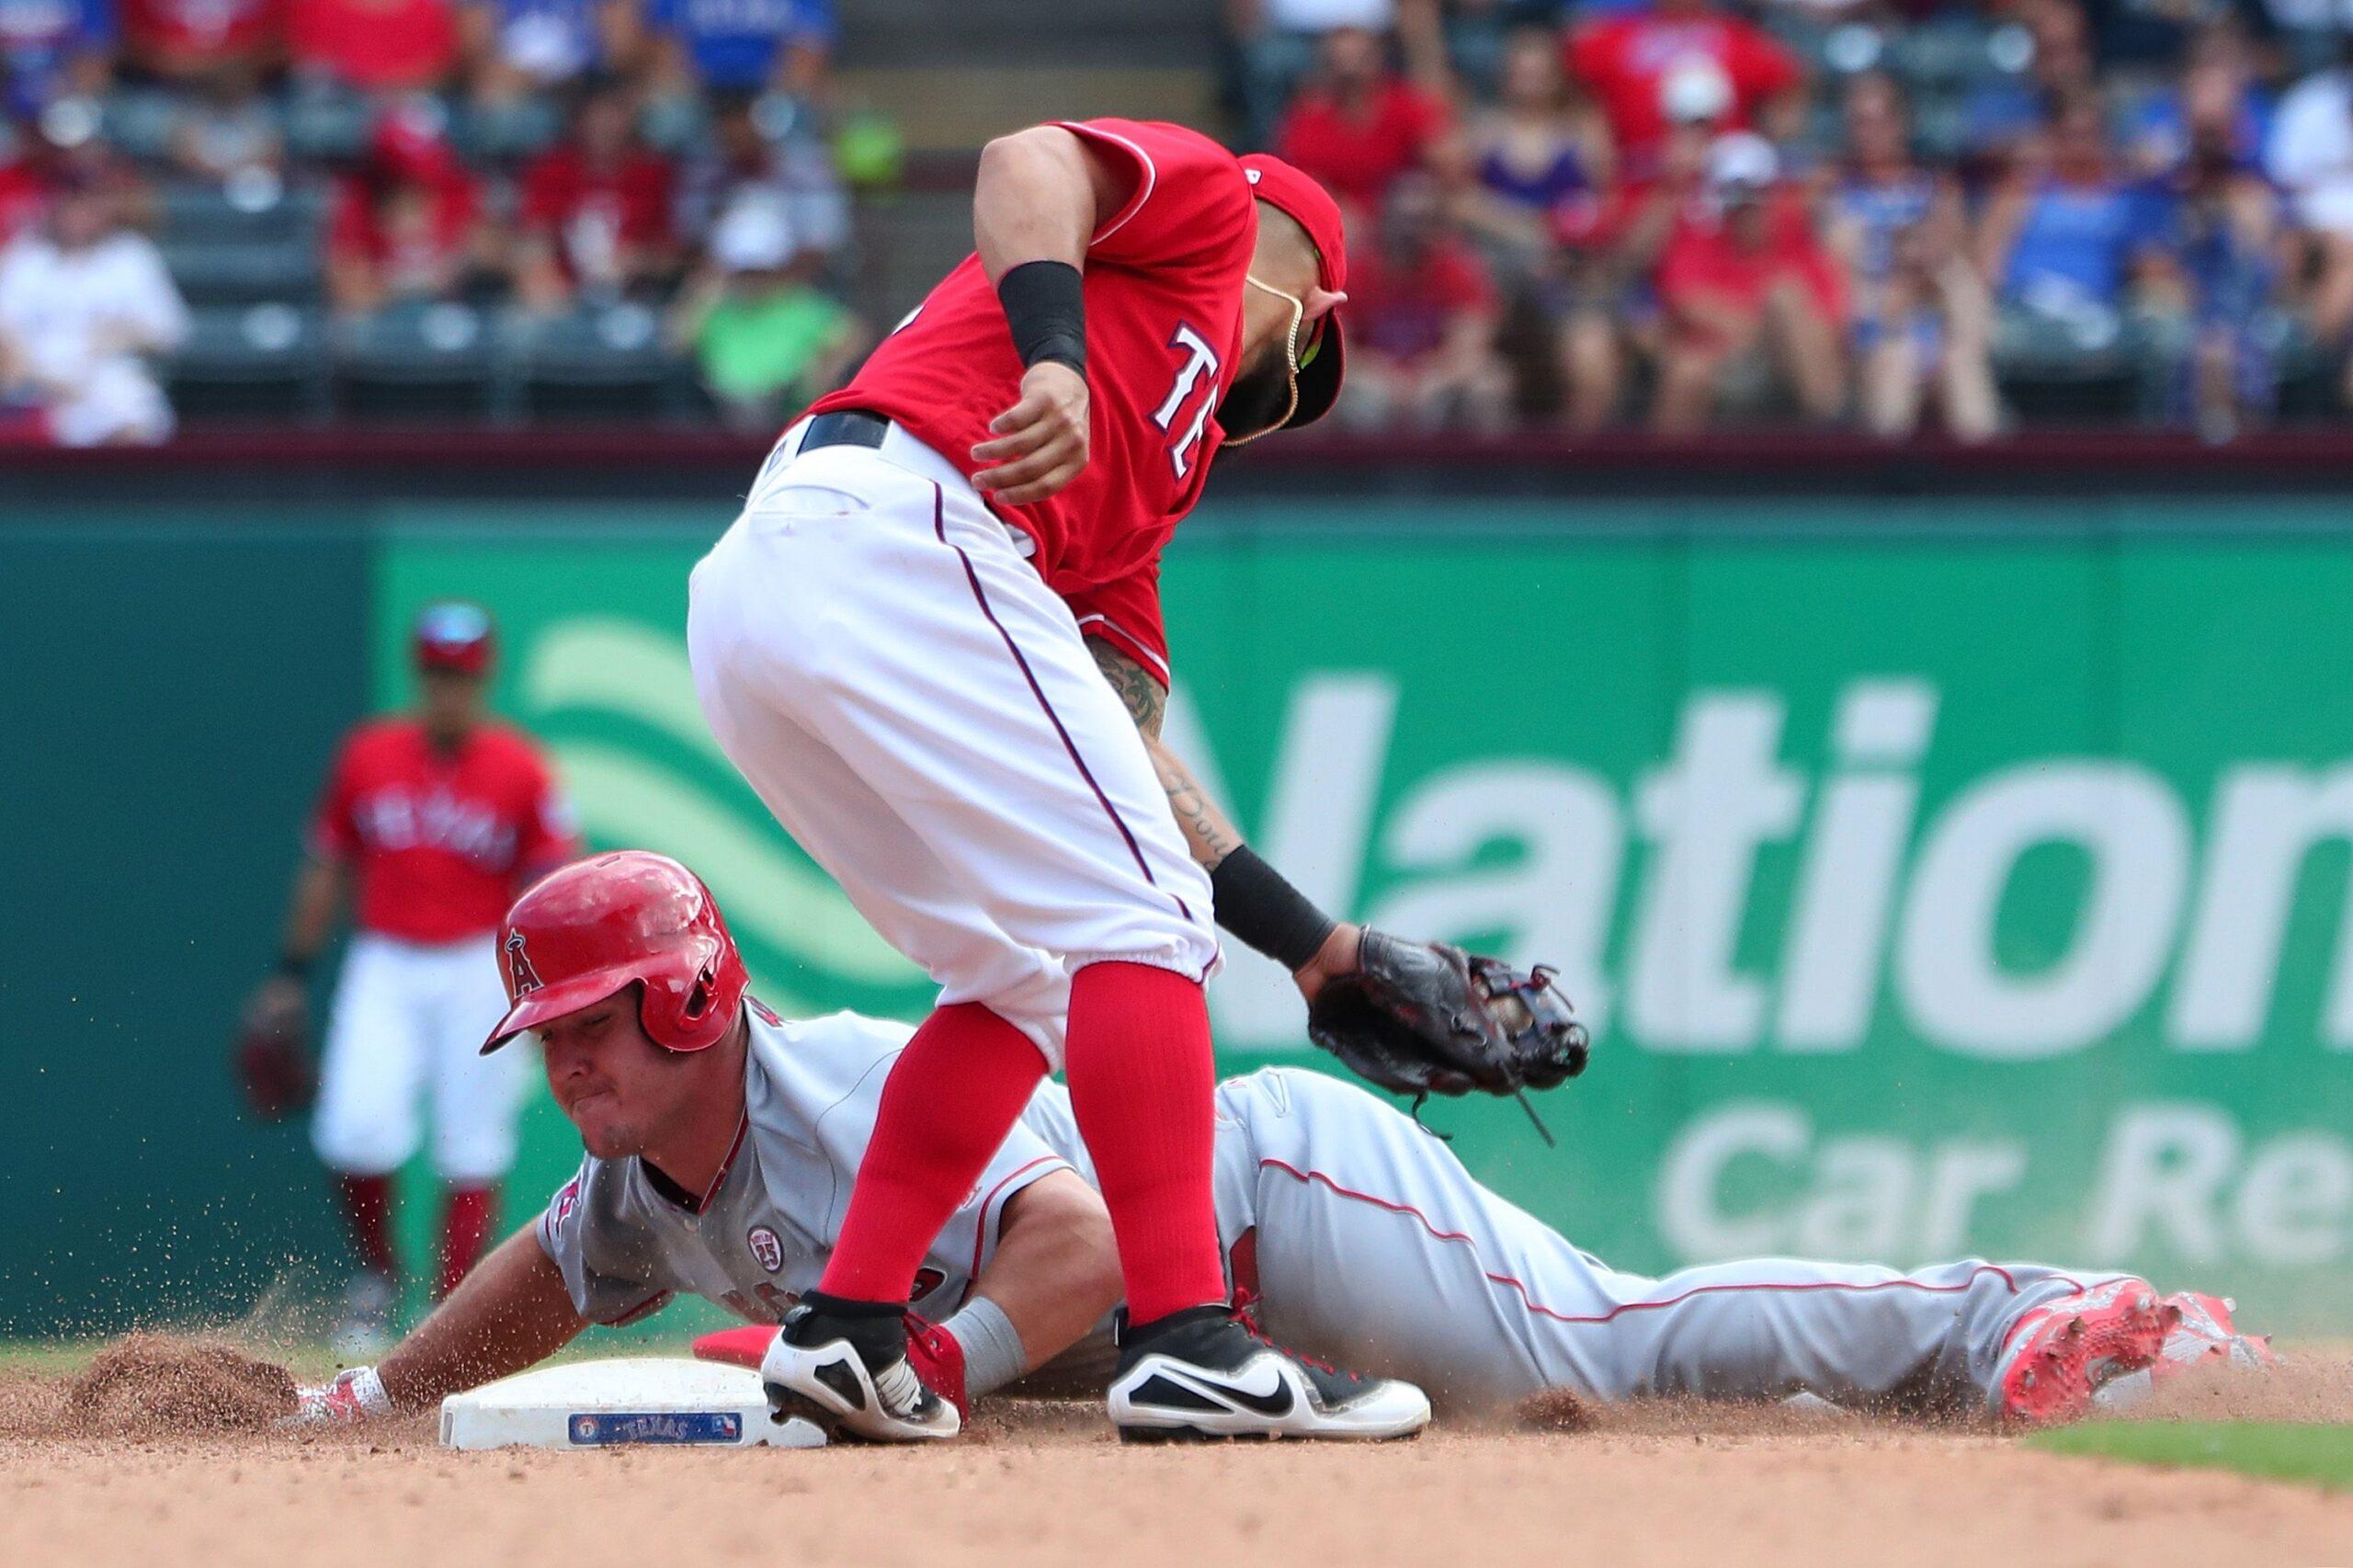
The baserunning metric that goes into WAR calculations comprises three factors: stealing bases, taking the extra base, and avoiding double plays. Trout’s worst season in stolen bases came in 2015, when he succeeded on just 11 of 18 tries; his worst season by each of the latter two factors came last year. Mashed together, the worst baserunning version of Trout adds just 0.8 runs with his legs over an average player, well below the 3.1 runs Trout is projected to contribute this season.
Moving on to defense, Trout is projected as an average fielder this year, factoring in the difficulty of his center-field position, but he has slumped with the glove before. In 2014, when he suffered his worst season with both his arm and range, his defense cost the Angels 8.4 runs. Combine his hypothetical losses on defense and the bases, and Trout’s projected WAR drops by a full win from its initial total of 8.3.
A decline in speed coupled with a decline in fielding prowess would engender some introductory whispers about Trout’s long-term future in center. But those issues alone would have no impact on his consensus standing atop the sport. A Mike Trout who runs and fields as poorly as possible would be worth 7.3 WAR in 2018, which would still peg him, comfortably, as the best player in baseball.
Step 2: More Strikeouts
Trout’s all-around dominance obscures the reality that he’s also the best hitter in baseball. His offense might even be underrated because he’s considered separately from bat-first stars like Giancarlo Stanton and Joey Votto, but Trout has posted a wRC+ of 167 or better in each of his full seasons. (That statistic is park-adjusted and measured on a scale in which 100 is league average, with 167 representing a mark 67 percent better than average.) Trout owns six of the top 14 batting lines since 2012; no other player appears on that list more than once.
Chipping away at that consistent dominance starts with relaxing his control of the strike zone. Since reaching a peak of 26.1 percent in 2014, when Trout led the AL in strikeouts, his K rate has fallen by about three points each year. Last season, he managed the dual feat of a career low in strikeout rate and a career high in walk rate. The first step to reverse those trends is to nudge Trout’s strikeout rate back up to 26.1 percent, giving him an extra 39 strikeouts this season compared to his projected total. That’s 39 fewer opportunities to homer or reach base or otherwise contribute in a positive way, which would cause Trout’s WAR to take its first real plummet.
A Mike Trout who runs and fields as poorly as possible while reversing his strikeout gains would be worth 5.6 WAR. It would easily be the worst full season of his career, and his batting line would drop to .270/.405/.539, which translates to a 152 wRC+. But even a compromised Trout would be an MVP candidate; his hypothetical 5.6 WAR trails only the projections for Stanton, Josh Donaldson, Carlos Correa, Kris Bryant, and Francisco Lindor, while tying Mookie Betts and Bryce Harper for sixth place among all position players in the majors.
Step 3: Fewer Walks
The second half of Trout’s strike-zone demise concerns his walk rate, which last year ranked third in the majors among qualified hitters. In 2012, though, a young Trout put forth a career low in both unintentional and intentional walk rate—and, for good measure, a career low in hit-by-pitch rate. Roll those three up into a collapse-of-Trout’s-strike-zone package and he would lose 48 automatic times on base, and although some of those plate appearances would redistribute as hits, the macro change would make him a less valuable presence at the plate.
A sudden penchant for strikeouts combined with a lack of walks would represent an odd development for Trout, especially if those trends persisted for a full season. Trout is the major leagues’ master of the adjustment; as Ben Lindbergh wrote last year, Trout has displayed a “remarkable ability to evolve” by fixing whatever small problems ail his game, from whiffs on high fastballs to a weak throwing arm. So at the very least, an extended spate of struggles in the most basic of plate-discipline metrics would pose some introductory questions about Trout’s future as a threat to become the greatest player who ever lived.
For just 2018, though, Trout would still receive MVP consideration, as a Mike Trout who runs and fields as poorly as possible while reversing his strikeout gains and losing control of the zone would produce a 145 wRC+ (.280/.360/.560) and be worth 5.1 WAR. His mark would tie Nolan Arenado’s projection for 10th place among position players in WAR, although he would still rate as the game’s most valuable center fielder.
Step 4: Fewer Homers
The redistribution of walks to batted balls in Step 3 actually increased Trout’s projected 2018 home run total to 40. That extra homer—along with many of its sisters—is about to disappear.
Last season, Trout managed a home run on 10.4 percent of batted balls, a career-best rate. His 2018 projection calls for a similarly lofty 9.8 percent. Dropping that rate to his career low, from the pre-juiced-ball 2013 season (5.9 percent), would send his projected homer total from 40 to 24.
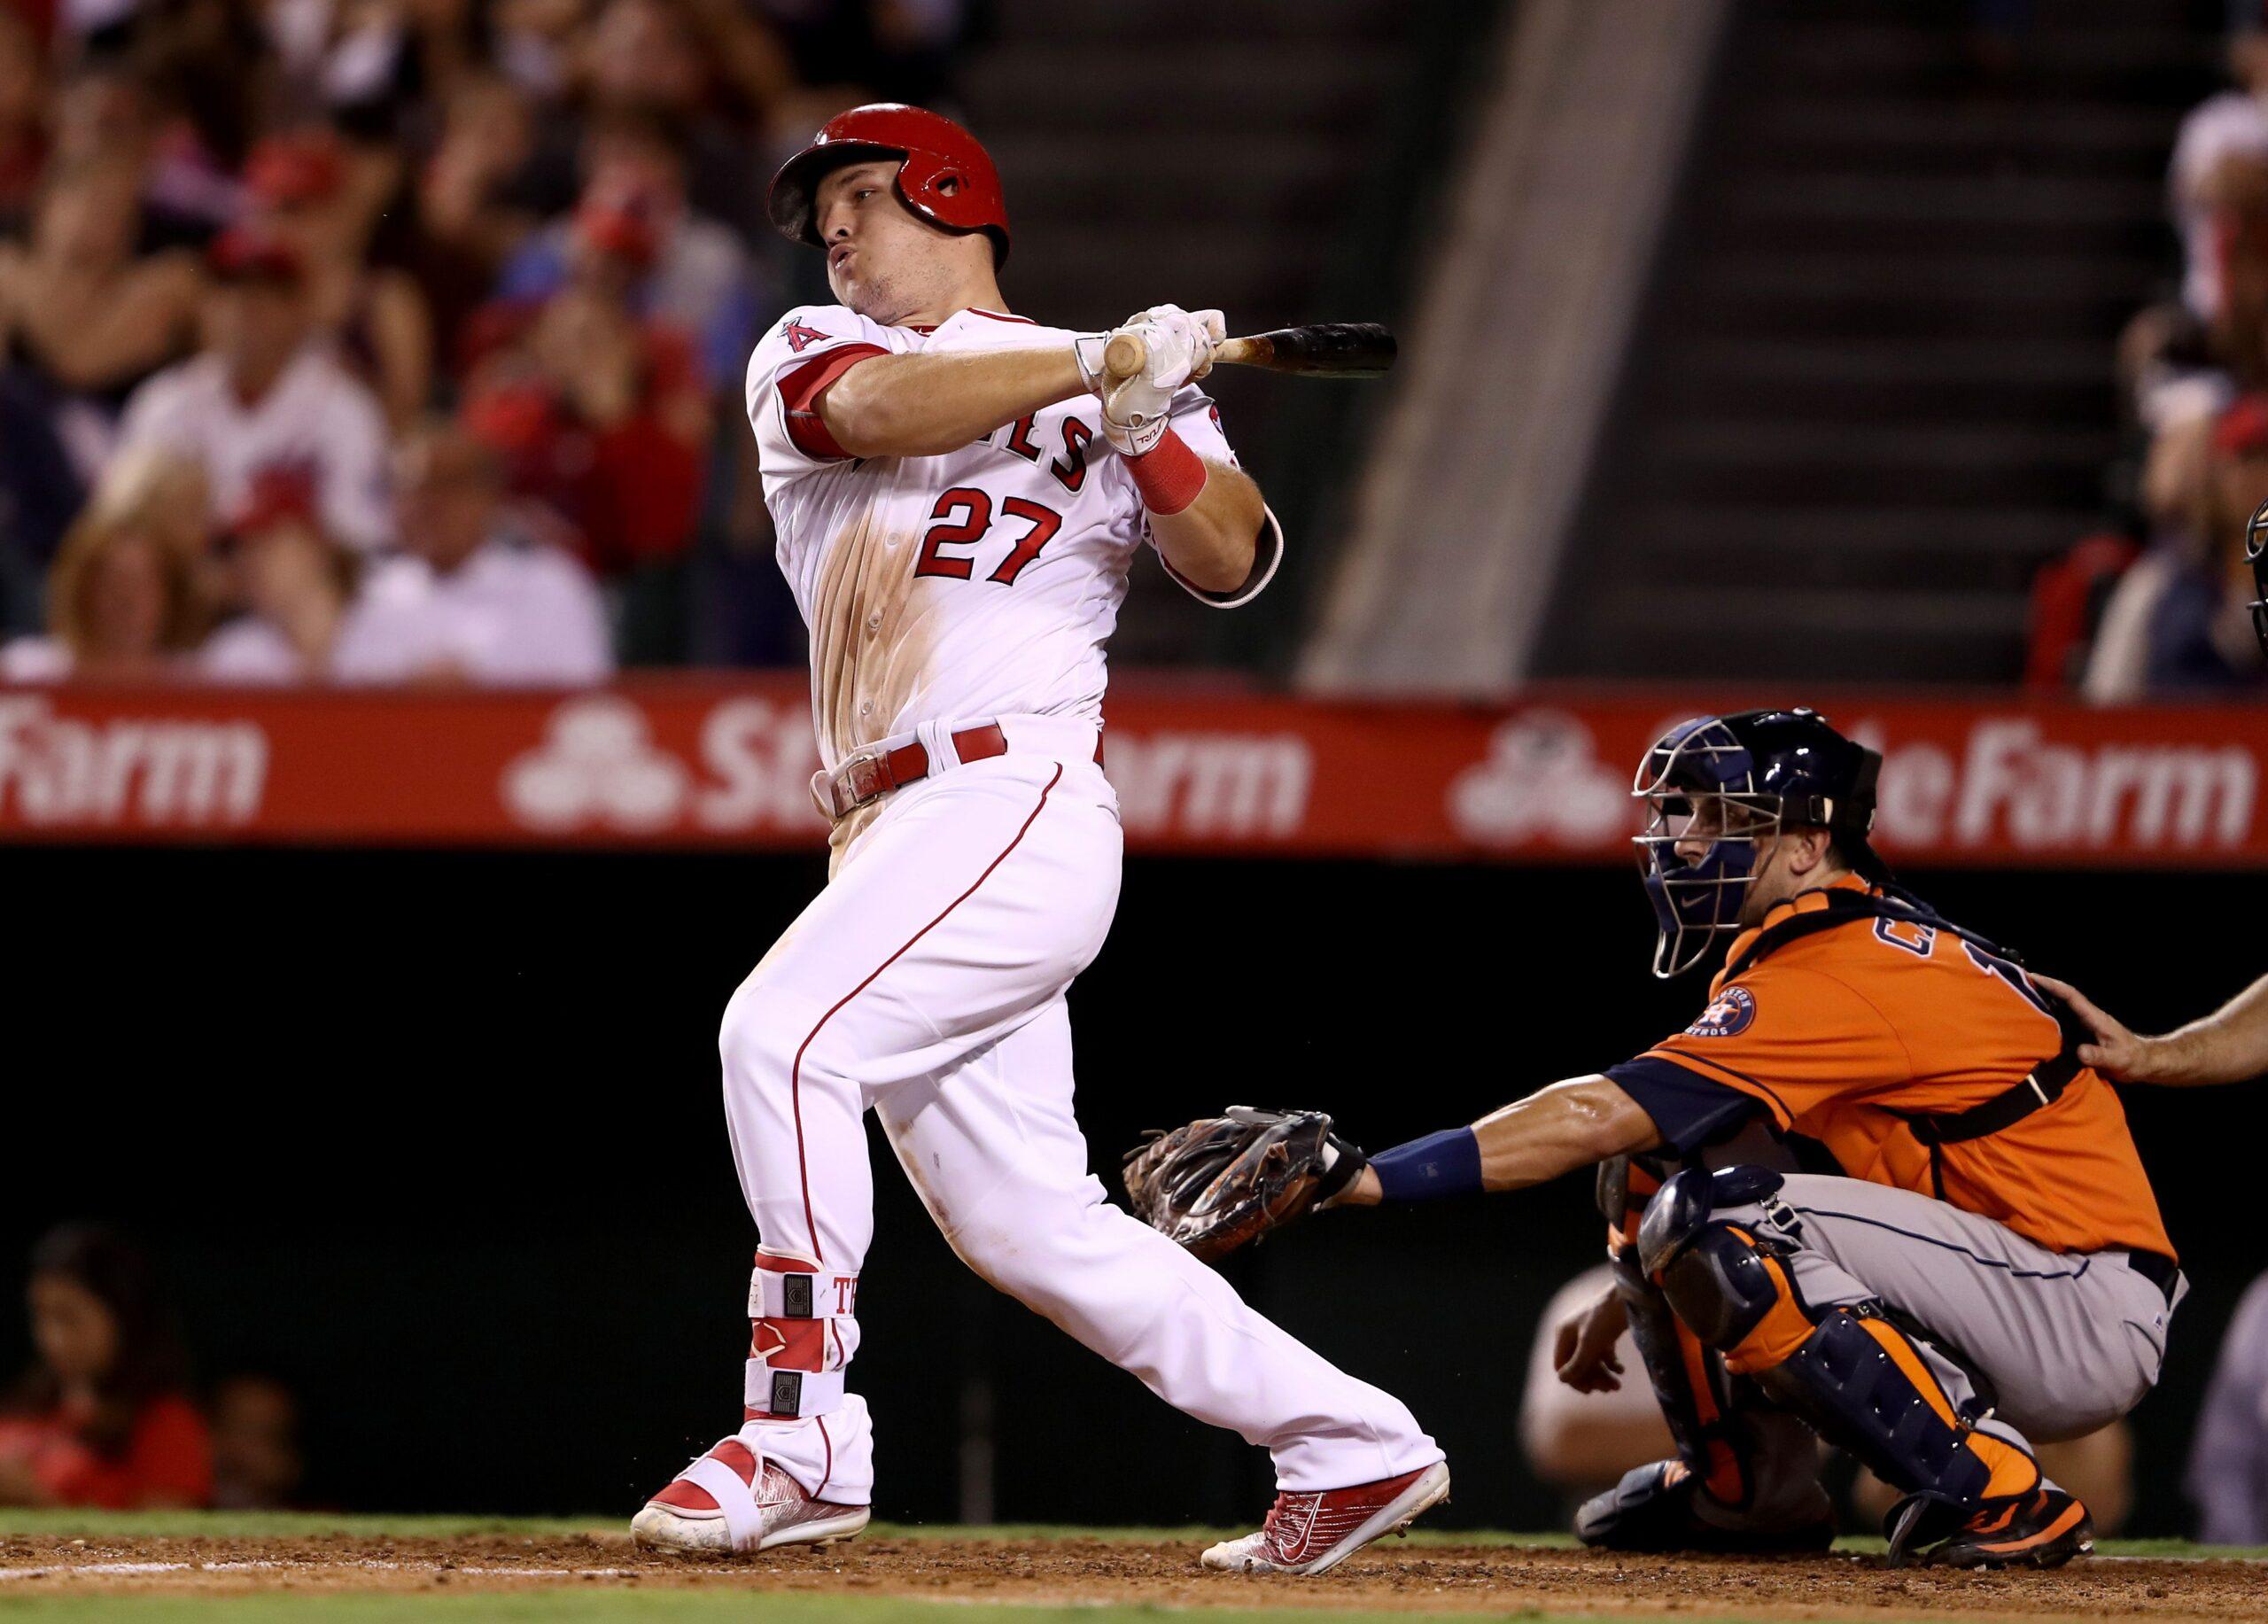
Of all the steps on this list, Trout losing his home run stroke would cause the greatest kerfuffle in the sport. A heightened strikeout rate equates to just an extra K or two per week and fits with the game’s broader trend; a sudden decline in his homer frequency, amid an ongoing leaguewide long-ball spike, would be reason for real concern for observers who have been conditioned to expect nothing less from Trout than consistent, almost daily superstardom. Number crunchers would consider whether Trout, whose $33.3 million base salary is the highest in the majors this year, is overpaid. The Trout vs. Harper debates would recommence. Someone, on some debate show somewhere, would float the theory that the presence of two-way wunderkind Shohei Ohtani is causing Trout to press at the plate.
Of all the steps on this list, Trout losing his home run stroke would also have the most drastic effect on his statistics. Hitting a home run is the most valuable action a hitter can contribute on a baseball field; removing 40 percent of his homers, even if some become base hits in play, would strip Trout of a huge chunk of his value.
A Mike Trout who runs and fields as poorly as possible, reverses his strikeout gains, loses control of the zone, and drops his home run rate would produce a 116 wRC+ (.261/.343/.459) and be worth 2.8 WAR. He would fall outside the top 50 in position-player WAR, although he’d still be as valuable as Addison Russell and Evan Longoria, and given the combination of his popularity and still-viable production, he’d still make his seventh straight All-Star team.
Step 5: Fewer Hits Overall
The last step in dosing Trout with kryptonite is to reduce his hits in play in addition to his hits over the fence. Trout’s .359 batting average on balls in play since 2012 is the third-highest among qualified hitters, thanks to his combination of speed and hard contact. But a slower and less powerful Trout would naturally collect fewer hits, and dropping Trout’s BABIP to his career low of .318—from last season, when so many of his best-hit balls went for homers rather than hits in play—would drop his batting line even further.
A Mike Trout who runs and fields as poorly as possible, reverses his strikeout gains, loses control of the zone, drops his home run rate, and loses his BABIP magic would produce a 113 wRC+ and a .256/.338/.452 batting line. He would be worth 2.5 WAR and barely rate as a top-10 center fielder, though he would tie with the projections for Justin Upton and Kole Calhoun as the Angels’ most valuable outfielder.
The worst hypothetical version of Trout is still better than versions of current stars that have actually manifested. Harper has already played a season worse than that, as have Stanton and Manny Machado. Barring injury, Trout seems immune to even average play, let alone a bad season by anyone else’s standard.
In the end, this thought experiment winds up being just—surprise—another confirmation of Trout’s greatness. The worst overall version of Trout based on his prior categorical worsts still adds baserunning value and non-disastrous defense, and he is better than league average at collecting walks, hitting homers, and reaching base on balls in play. He’s not a $33 million–per-year player, but he’s a fringe All-Star who fits comfortably in the top half of a playoff lineup and is worth starting in even the shallowest fantasy league.
Oh, and performing the reverse calculations by maximizing Trout’s output for each component would yield a 13.8-WAR season, which would be the single-season high for any player other than Babe Ruth. That’s one of the possible timelines for this season, too.
