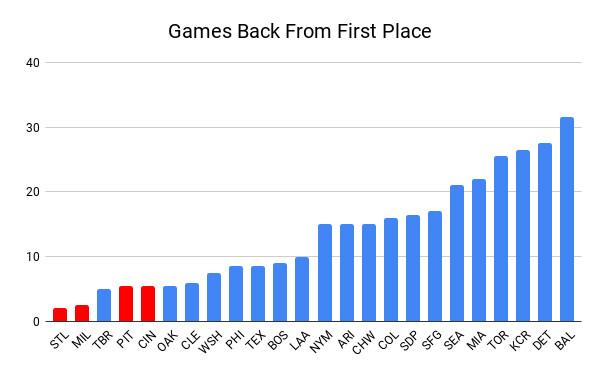
Sort all of MLB’s non-division leaders by their distance from first place, and a clear, albeit curious, pattern arises. The first team—the closest to first place—through Monday’s games is the Cardinals, two games back of the NL Central–leading Cubs. Second is the Brewers, also in the NL Central, at 2.5 games back. Third is the Rays in the AL East—and then tied with Oakland in the AL West come two more NL Central squads, the Pirates and Reds, both 5.5 games back of Chicago. Then, and only then, come the remaining 18 MLB teams.
The entire NL Central, in other words, is closer to the division lead than nearly every other non-division leader in the majors. That fact is just as striking in visual form; here, the NL Central teams appear in red.
With the now-single trade deadline just two weeks away, this congestion, as well as the broader NL congestion that sees just two of the league’s 15 teams more than 3.5 games out of a playoff spot, forces some of the division’s teams into a buy-or-sell quandary. Should the Reds trade impending free agents like Tanner Roark and Yasiel Puig? Should the Pirates seek offers for Felipe Vázquez? How active should the Cardinals be, as a near-.500 team with a spotty recent trade history? It also raises a backward-looking question in addition to those forward-looking concerns: Might this year’s NL Central be the closest division race ever?
That’s an important consideration in the 2019 baseball landscape, which if not for the NL Central would appear mighty mundane at the moment, at least in the standings. Besides the Cubs, every other division leader nurses a lead of at least five games, which could translate to a lackluster September sprint. As Ben Lindbergh documented at the All-Star break, the current division leaders “have higher average odds of holding on to take their respective titles than any crop of midseason division favorites from 2012 to 2018” (the span of time representing the two-wild-card era). In addition to fewer September thrills, Ben noted, these gaps could yield a less compelling deadline as well: “Most of the division leaders are sitting pretty enough that they don’t have a huge incentive to add at the deadline for the purposes of retaining those top spots (although they may still want to add for October).”
The NL Central, however, is separate from this analysis—a mishmash in which no team has trailed by more than nine games all season. The Reds beat the Cubs and the Cardinals beat the Pirates—as occurred on Monday—and suddenly the whole division is playing Twister in the standing order.
To determine a division’s parity, we can calculate the standard deviation—or, essentially, the overall spread—of its winning percentages. Do that for every group of teams since MLB created divisions in 1969, and we can rank all 256 divisions over the last half-century from closest to most spread out. First, here are the divisions with the most parity, as well as their standard deviations and what that spread in winning percentage looks like when translated to a 162-game record.
MLB Divisions With the Closest Spread, 1969-2019
The 1994 AL West is an infamous division in baseball history; the Rangers led with a 52-62 record that would convert to a 74-88 mark over a full year. But that season ended early due to the players’ strike, so the division’s placement atop this list comes with a large asterisk. That leaves the 2005 NL East as the closest division of the last half-century. The Braves won 90 games to claim the NL East that year, the last of Atlanta’s 11 consecutive division titles, while the Nationals brought up the rear with a respectable 81-81 record in their first season in Washington. Discounting the 1994 strike year, the 2005 Nationals are the only last-place team in MLB history to finish within single digits of the division winner.
That example adds a note of caution: Even if the NL Central’s overall spread remains this proximate, it’s not guaranteed to provide a dramatic late-season race. The whole 2005 NL East was close, but not exactly thrilling at the top; Atlanta led by at least four games every day in September. But the 2019 NL Central could also go the route of another close division: the 1973 NL East, where four different teams either led the division or drew within a game of the top in September, with the Mets winning despite sitting in last place as late as August 30 and not holding sole possession of first place all season until September 21.
So the 2019 NL Central looks like one of the closest top-to-bottom divisions in MLB history, which could set the stage for a spectacular September stretch run. On the other end of the competitive spectrum is the 2019 AL East, where the woeful Orioles were 30 games back before the end of June, and where the Blue Jays are on pace to lose 100 games for the first time since they did so each year from 1977 to 1979, their first three years of existence as an expansion franchise. Here are the divisions with the least parity since 1969.
MLB Divisions With the Farthest Spread, 1969-2019
The AL East has been here before, and recently. Last year’s placement atop the list makes sense given Boston’s 108 wins and Baltimore’s 115 losses. The Orioles finished 61 games back of Boston, by far the largest deficit of the division era, which contributed to the record spread throughout the division. (The previous record was “just” 52 games, from the 1998 Marlins; next was 51 games, from the 1998 Rays. That summer saw some truly atrocious baseball in Florida.) In fact, we expected 2018’s differentiation to carry over to 2019—based on a repository of preseason projections dating back to 2005, this year’s AL East was forecast as the most lopsided on record.
The 2019 AL Central is also keeping its eastern friend company, with the terrific Twins and lugubrious Royals and Tigers helping to push the AL Central high up the list. Teams in last year’s AL Central combined for a .436 winning percentage, which translates to 71 wins over 162 games and is the worst-ever mark for a division—so while this year’s version might be historically disparate, at least it has one worthwhile club.
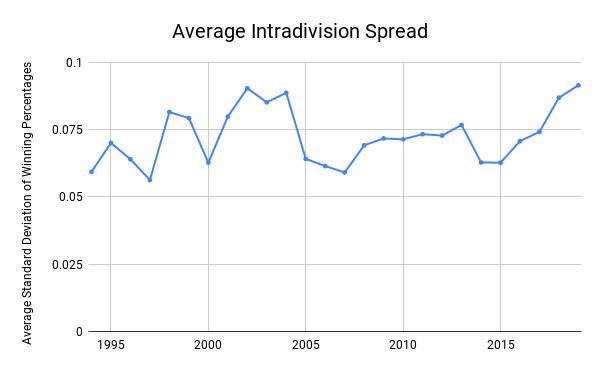
The fact that some of this year’s records are so spread out isn’t much of a surprise, given the ongoing split between “superteams” at the top of the standings and tankers at the bottom. At the moment, four teams are on pace for at least 100 wins, and five are on pace for at least 100 losses. Both marks would be records. Only twice before have three teams won 100 games and three lost 100 games in the same year—and one was 2018. Even with the close NL Central, the 2019 season has the least overall intradivision parity of the six-division era. And the spread among teams has been climbing for the last half-decade.
The 2019 NL Central as the glaring, apparent exception to this recent trend is noteworthy expressly because every one of its teams is trying to win now, engendering more and fiercer competition throughout the division. The Cubs have been buyers ever since completing their rebuild. The Brewers have been aggressive over the last two winters, adding MVP Christian Yelich, Lorenzo Cain, Yasmani Grandal, and Mike Moustakas. The Cardinals have traded for Paul Goldschmidt and Marcell Ozuna, and signed Andrew Miller. The Pirates got in on the action with an ultimately misguided move at last summer’s trade deadline, but adding Chris Archer via trade at least signaled something of a win-now mentality for the long-cautious franchise.
Even the Reds, who entered this season with four consecutive last-place finishes, swung for the fences to compete this season, acquiring Sonny Gray, Yasiel Puig, Matt Kemp, Alex Wood, Tanner Roark, Derek Dietrich, and others this winter. Not all of those moves worked out—Kemp has since been released; Wood hasn’t pitched yet due to a back injury—but Gray made the All-Star team, Dietrich has belted 19 home runs, and Cincinnati is posting its best winning percentage since 2013. Other last-place teams throughout the majors are taking a much longer-term view toward competing, siphoning off star players and rolling over for the superteams that lead their divisions; every NL Central team is trying and thus supplying almost unprecedented intradivision competition.
We would expect some of the extreme paces around the league to level off in the second half, but the same kinds of patterns should still hold even if one or two individual teams fade. If anything, public projection systems think the NL Central standings will look even more compressed by the end of the season than they are now. Here’s that same original standard deviation chart with lines for the FanGraphs and Baseball Prospectus end-of-season projections added. By any measure, the 2019 NL Central looks historically close.
MLB Divisions With the Closest Spread, 1969-2019
On the other end of the spectrum, the same extreme projections don’t quite hold for the AL East. FanGraphs and BP both think that the Yankees and Rays will cool off from their current paces over the remainder of the season, and that the Blue Jays and Orioles will perk up by a meaningful margin. Squeezing the extremes on both sides toward the middle increase the division’s projected relative parity. But the first half’s damage is already done, and even the more conservative projections still see the 2019 AL East approaching the 2018 version at the top of the leaderboard.
Back in April, just a few weeks into this season, Ben Lindbergh wrote another piece analyzing early trends in the baseball season; the headline read “Just About Everything This MLB Season Has Been Extreme.” He was referring to in-game trends like home runs hit and sliders thrown. But the same sentiment holds in a zoomed-out level, too, from just looking at the standings. The NL Central might end the season as the closest non-strike division in history; the AL East might end as the least close division if only it can surpass last year’s iteration by autumn. The season’s standings are as extreme as ever—they fit the 2019 majors, too.