Two things were true about Brewers star Christian Yelich’s outlook leading up to Opening Day: The reigning NL MVP was projected to be one of baseball’s best players in 2019, and he was also projected to suffer one of the largest declines compared to 2018.
In FanGraphs’ preseason position-player projections, Yelich ranked seventh in projected WAR with 5.3. But thanks to his lofty total from 2018 (7.6), he also ranked seventh in projected WAR dropoff. It might seem strange that a 27-year-old who only just tapped into his long-suspected power would be expected to suffer a setback so soon. But that’s the problem with being an MVP: In most cases, the encore can’t quite match the previous performance.
Yelich’s award-winning 2018 was an almost archetypal MVP campaign. From 1961 through 2017, MVP-winning position players, on average, made 666 plate appearances and amassed 7.5 WAR with a 161 wRC+. With 651 PA, 7.6 WAR, and a 166 wRC+ last season, Yelich finished in the vicinity of each of those three figures. And one thing history tells us about MVPs is that they tend to head downhill the following season.
The table below displays the average playing time and performance of 98 non-pitcher MVPs in MLB’s expansion era (1961-present) in their MVP seasons and follow-up campaigns, excluding the 1981 and 1994 strike seasons and the campaigns preceding them.
MVP Regression, 1961-2018
Obviously, the vast majority of the MVPs remained very valuable players the year after: Only 16 of 98 defending MVPs failed to surpass 3.0 WAR. Of course, a lot has to go right for a player to win an MVP award: He has to stay healthy, and he has to play reasonably close to the top of his range of realistic outcomes, which means there’s usually much further to fall after an MVP season than there is room to improve. On average, MVPs have tended to lose about 50 plate appearances, two WAR, and 18 points of wRC+ in the year after taking home the hardware. Only 21 of 98 raised their wRC+, and only 19 of 98 elevated their WAR.
All of which is to say that Yelich’s projected decline was completely reasonable in light of his MVP predecessors. The projection systems weren’t saying that Yelich’s talent was already eroding; they were saying that even with roughly the same talent, Yelich likely wouldn’t enjoy the same success.
Naturally, Yelich started the season by becoming the sixth player ever to homer in his team’s first four games of the season. His bid to become the first player with a season-starting five-game dinger streak failed on Monday, when he settled for doubling and scoring the winning run against the Reds, which dropped his seasonal slash line to .412/.565/1.235. (A 2-for-5 on Tuesday lowered that line further, to a measly .409/.536/1.091.)
Through the past three seasons, Yelich has ranged from a five-win player to an eight-win player, rounded to the nearest whole number. Either way, he’s great. But whether he’s five-win great or eight-win great might make a major difference, given that the NL Central is arguably baseball’s most competitive division. Last year, after all, the Brewers needed every iota of Yelich’s value to catch up to the Cubs and force a tiebreaker, which they won thanks in part to a 3-for-4 day from their star outfielder, who would go on to rake against the Rockies in the NLDS.
If there’s a case to be made that Yelich is more susceptible to regression than the average MVP, it’s the singularity of his full-season stat line last year. Yelich hit .326/.402/.598, won a batting title, and fell two dingers short of tying for a home run crown. But he also recorded a ground ball rate of 51.8 percent, which is well above the MLB non-pitcher average of 42.8 percent. It’s almost impossible to produce that much power while hitting the ball on the ground more often than not.
FanGraphs provides detailed batted-ball data going back to 2002; among the 253 hitters who qualified for the batting title from 2002 to 2018 and recorded a ground ball rate of at least 51.5 percent, Yelich was the best in isolated power (by 39 points), wRC+ (by 18 points), HR/FB rate (by more than six points), and home runs (by six). Whenever a player does something unprecedented—or at least without recent precedent—the odds are against a repeat performance. Yelich made the most of his relatively few fly balls last season, but his outlier line marked him as a decline candidate.
On the other hand, a compelling case existed that Yelich might be more resistant to regression than the typical MVP. Yelich’s full-season stats, which were robust but not eye-popping, disguise the left-handed hitter’s explosion late last year. Upping his power while lowering his strikeout rate, Yelich posted a Barry Bondsian 220 wRC+ in the second half of the season, easily outstripping his closest competitors. He racked up 5.4 WAR after the All-Star break alone, which matched his previous full-season high. If that’s the real Yelich—as the results from the first week of this season would suggest—then Yelich’s 2018 may have been the base camp before the final summit.
In general, it’s dangerous to put too much stock in second-half stats, considering the smaller samples involved. Although some evidence suggests that second-half performance tends to correlate more closely with the subsequent season than first-half stats, full-season stats are still more trustworthy. FanGraphs writer Dan Szymborski, who maintains the ZiPS projection system and has investigated the predictive power of second-half performance, says, “I’ve found it not to have value.” Ending the season on a league-leading hot streak can’t be a bad sign, but it’s no guarantee of avoiding regression.
Except … well, look at the change in Yelich’s longtime bugbear, ground ball rate.
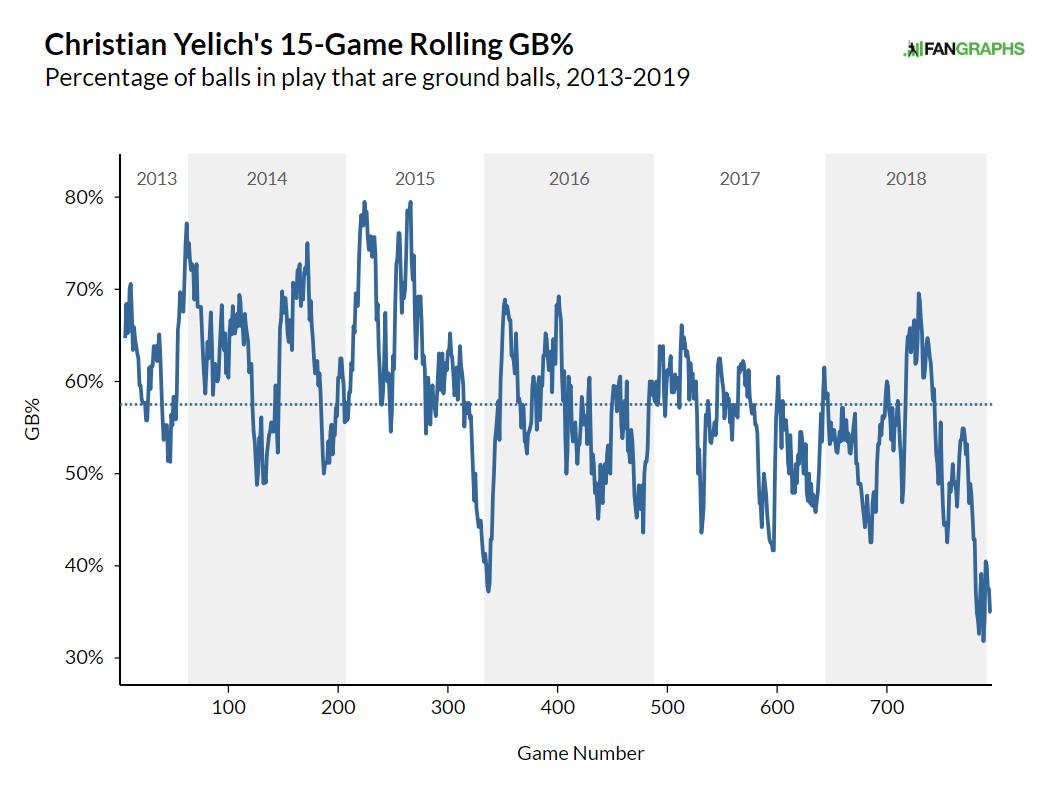
Yelich’s torrid pace in the second half of last season corresponded with a dramatic decrease in his ground ball rate, which persisted in his first several games of 2019. Since the midpoint of 2018, Yelich is lifting the ball with greater regularity. The difference is also stark if we break down his gradual (and more recently, rapid) improvement in ground ball rate through five well-defined periods of time. The table below shows his ground ball rate during each of those slivers, along with his ordinal and percentile ranks among hitters with a minimum number of plate appearances through the same spans.
Yelich Rising: Ground Ball Rate Ranks, 2013-19
In recent years, hitters have apexed closer to the start of their careers, but Yelich took a more traditional path to his peak. In his first few seasons, his ground ball rate was the third-highest in the game, trailing only light-hitting shortstops Derek Jeter and Everth Cabrera (neither of whom was long for the league). In the next two seasons, 2016 and 2017, he lowered his ground ball rate significantly but still sat in the fourth percentile among all qualifying hitters. During the first few months of 2018, nothing changed. But after July, Yelich had a ground ball breakthrough. And since September, he’s finally kept his ground ball rate below the league average.
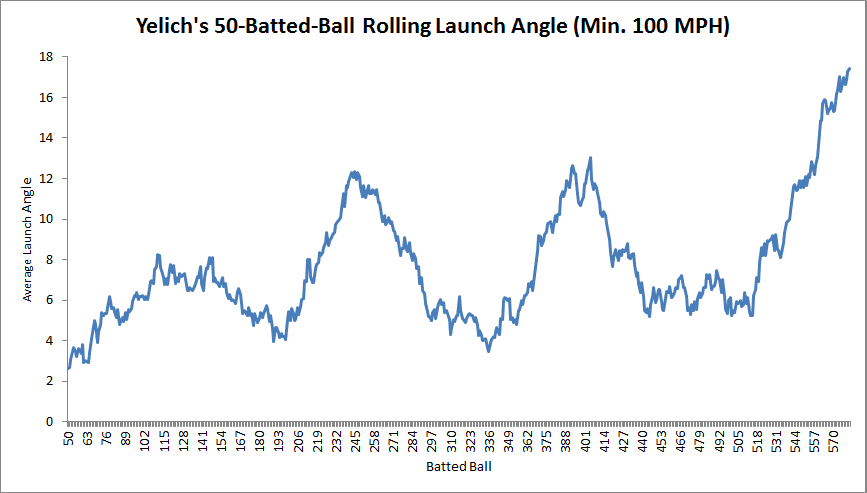
Granted, we’re slicing that last sample thin, but ground ball rate reflects a player’s true talent fairly quickly. Yelich’s full-season average launch angle last year (4.7 degrees) was identical to his figure from 2017, and while it did increase somewhat as the season proceeded, both Yelich and Brewers sources insist that he hasn’t made any major, conscious adjustment in search of fly balls. But as Jeff Sullivan noted at FanGraphs last fall, when Yelich hits the ball hard—in other words, when he hits the ball the way he wants to hit it—it’s leaving his bat at a far steeper upward trajectory than before. The graph below shows his rolling-average launch angle on balls hit 100 mph or higher in the Statcast era (2015-present), revealing a recent peak.
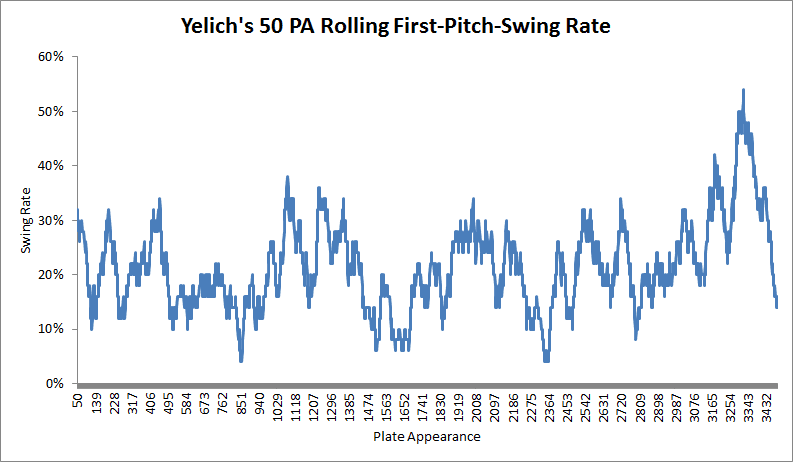
Sullivan showed last August that Yelich started swinging at a higher rate of first pitches, which may have helped him do damage when his victims were expecting easy strikes. However, that trend hasn’t held up, likely because he stopped catching opposing pitchers by surprise. Since Sullivan’s observation, Yelich has gone back to being passive on 0-0 deliveries.
In fact, while one wouldn’t know it from the number of balls he’s sent into the stands, Yelich hasn’t swung a lot lately overall. The slugger’s recent swing rate has plummeted to a small-sample career low. That’s probably because he’s seeing fewer pitches to hit: Over the same span, the percentage of pitches in the strike zone against Yelich has also bottomed out.
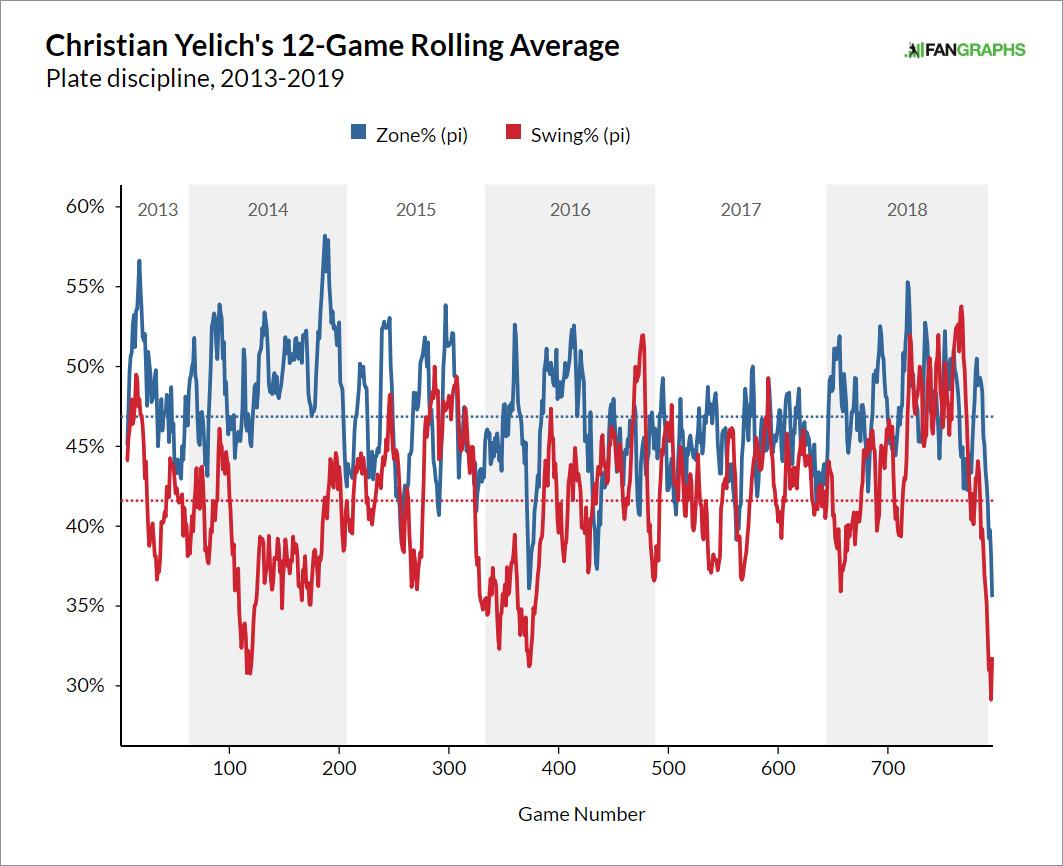
Pitch location can indicate opponents’ level of respect; when pitchers start to avoid the strike zone, it’s sometimes a sign that they respect a player’s power. Even though they haven’t often opted to issue free passes, pitchers are approaching Yelich as if his fly ball barrage and unparalleled power are largely for real. It would be easier to explain Yelich’s surge if he’d made a dramatic physical or philosophical adjustment or professed a newfound affection for fly balls, as some hitters have. It would be satisfying if we could make “before” and “after” GIFs of his strokes or setups, place them side by side, and point to the smoking swing change. Instead, what we’ve seen is a series of subtle and outwardly imperceptible adjustments—better swing decisions, fewer grounders, more hard-hit balls at optimal angles—that have spawned an extremely unsubtle improvement.
Since last August 1, 45.5 percent of Yelich’s flies have left the park, easily the highest rate of any hitter during that span. Since 2002, no hitter with at least 250 plate appearances has hit even 40 percent of his flies over the fence. That Yelich has cleared 45 percent over a sample of more than 250 PA hammers home how unbelievably hot he’s been.
It also reminds us that he has to come back to earth sometime soon. Heck, he hasn’t homered in his past two games; in the past few months of action, that’s about as close as he’s come to a slump. But fewer flies leaving the park won’t hurt him as much as it would have when he was hitting far fewer flies to begin with. Regression will come for Christian Yelich, but in light of what he’s learned, it’s unlikely to cost him his hard-won superstar status.
Stats are current through Monday’s games.