

It’s easy to overlook now that interleague games aren’t concentrated in self-contained stretches of the season, but the American League is still eating the National League’s lunch. The AL’s interleague dominance, which started in the early 2000s, has extended into its 14th consecutive year, with the AL taking 64 of the first 109 of the leagues’ 300 scheduled face-offs, good for a .587 winning percentage.
While it’s fair to say that the AL is stronger than the NL on average — in addition, perhaps, to benefiting from a DH-derived advantage in AL-hosted interleague games — certain subsets of each circuit buck the trend. The 2017 AL Central, for instance, has a losing record against NL teams, and the NL West has a winning record against AL teams, even though the Dodgers have yet to play an interleague game. To explain a large chunk of the AL-NL gap, we must look, like Aragorn, to the East.
Through the first 36 percent of the season, the AL East has played like one of the strongest divisions ever, while the NL East has looked like one of the weakest. Some mismatch between the two was pretty predictable: FanGraphs’ preseason projections forecasted three NL East teams to be worse than the worst AL East team. But the degree of difference between them has outstripped expectations, in part because of the dramatically different fortunes of New York’s two teams. The first-place Yankees, projected to be the AL East’s last-place finisher, have exceeded their projected winning percentage by a wider margin than all but three other MLB teams. Meanwhile, the Mets — the NL East’s only non-Nationals preseason-projected playoff team — have fallen short of their forecasted winning percentage by more than any MLB team but the Giants. And to make matters worse for the NL East, the Phillies and Marlins rank fourth and seventh, respectively, on the list of underperformers.
Thanks to the Yankees’ surprising start and the bottom falling out for a few NL East teams, the two divisions’ results have been extreme so far. One way to measure a division’s strength is by assessing its performance against opponents outside its division. I asked Dan Hirsch, creator of historical stats and analysis site The Baseball Gauge, to send me measurements of division strength during the “Divisional Era” (1969-present), which he calculated using a method similar to the “simple rating system” displayed at Sports-Reference’s sites. On the table below of the 10 strongest divisions over that span, “RDiff” indicates the listed division’s average per-game run differential in games against nondivisional opponents, while “SoS” (strength of schedule) indicates the average RDiff of the listed division’s opponents (excluding divisional opponents and games against the listed division). The right-most column, which displays the division’s strength, is the sum of RDiff and SoS.
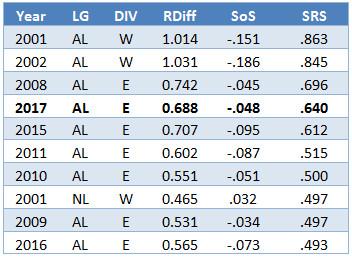
Only one of these divisions hails from the NL, which reflects the AL’s longstanding advantage. The smaller the division, the easier it is for its teams to be uniformly dominant. That explains why the only division that dates from before realignment (which produced three divisions per league instead of two) to crack the all-time top 20 — and only barely, at no. 20 — is the seven-team 1978 AL East, whose top two teams had a famous photo finish. It also explains why the 2001 and 2002 AL West, which had only four teams in total, rank first and second. In 2001, the Mariners won a record 116 games and the Moneyball A’s were hard-luck runners-up at 102–60, while the Angels and Rangers ran up respectable records with win totals in the 70s. That division collectively went 109–63 against the AL East, 99–73 against the AL Central, and 42–30 in interleague play. The following year, the A’s increased their overall win total to 103, the Angels won 99, and the Mariners still snagged 93 victories while the Rangers once again brought up the rear.
Among the five-team divisions that make up most of the table, the AL East, unsurprisingly, shows up as the perennial powerhouse, claiming seven of the top 10 spots and 12 of the top 20. For the past two decades, the Yankees’ spending — which was soon supplemented by Boston’s — has forced the division’s also-rans to lure talent to the division in hopes of keeping pace, a trickle-down effect that keeps renewing the rosters of AL East teams. While the NL East is home to two teams in the throes of long-term youth movements (as well as one whose ownership has hamstrung its efforts for ages), it’s been years since an AL East team decided to tear down its roster and rebuild. According to Baseball Prospectus, the AL East’s combined payrolls this year have the NL East’s beat by more than $134 million.
The only incarnation of the AL East whose strength surpasses this season’s so far is 2008’s, which featured a battle between the 97-win Rays and the 95-win Red Sox, shadowed by the 89-win Yankees and 86-win Blue Jays (and, at a great remove, the 68-win Orioles). This year’s model looks a little different: The highs probably won’t be as high, but the lows won’t be nearly as low. The Red Sox are currently projected to take the title with only 90 wins, with the Rays finishing last at 81–81. If the projections come to pass, this year’s AL East — which featured a historic four-team race late last year — will be only the third division ever without a losing team, following in the footsteps of the 1991 AL West and 2005 NL East.
This year’s NL East appears even higher on the list of weakest divisions than the AL East did on the list of the strongest.
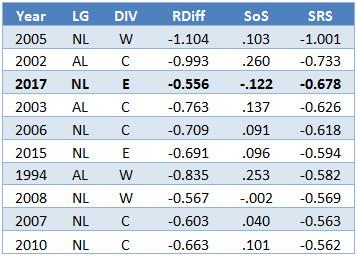
The only divisions weaker than the current NL East are the 2005 NL West — which was won by the 82–80 Padres — and the 2002 AL Central, which had two 100-loss teams. This year’s NL East teams have had a fairly easy interdivisional schedule and have still been outscored by almost 0.6 runs per game. That’s enough to vault the division a few spots above the likes of the 1994 AL West, a four-team group in a strike-shortened year whose leader went 52–62 before baseball’s labor dispute mercifully put the division down.
In the East, the Nationals have gone 17–10 against intradivisional opponents en route to a 37–21 overall record and an 11.5-game lead on the Braves and the injury-decimated Mets, whose shorthanded staff has produced the majors’ second-highest ERA, pitcher’s park be damned. The Marlins, still suffering from the effects of José Fernández’s death, trail slightly behind, leading only the hapless Phillies, who have baseball’s worst record (21–36). D.C. aside, it’s a bleak baseball landscape: All five AL East teams have higher playoff odds than any non-Nationals NL East team.
With only slightly more than a third of the season behind us, there’s still time for the two Easts to come closer together. At this point in the season, preseason projections are still more accurate indicators of rest-of-season performance than in-season performance so far, and in many cases, those early estimations foretold different stories from the ones we’ve watched thus far. In the AL East, the Jays are the only team to significantly underperform its projection; in the NL East, the Nats are the only team to overperform theirs. Odds are that as some clubs’ courses correct, these divisions will look a little less dominant or inept than they have to this point. But only a little: It’s not too soon to say that this year’s best and worst baseball belongs to the East.