
If you’ve looked at any early projections for the 2017 season, you’ve probably noticed that there’s next to no separation between the Cubs and baseball’s other elite teams. The ZiPS system likes them a little bit better than the Dodgers, while Steamer gives the slight edge to L.A. PECOTA, meanwhile, thinks the Cubs will finish with the fourth-most wins.
Why can’t the Cubs get more respect? For one, the computers don’t account for playoff performance, so the Cubs’ 11 additional wins against good postseason opponents, and their status as defending champions, don’t help them here. For another, it’s not entirely the same team, although we can quibble about whether the Cubs’ winter depth-chart changes left them stronger or weaker than they were last year: Jon Jay and increased contributions from Kyle Schwarber and Albert Almora replace Dexter Fowler and Jorge Soler; Brett Anderson succeeds Jason Hammel; and more of Mike Montgomery plus whatever Wade Davis and Koji Uehara have left offset the loss of Aroldis Chapman. But this roster looks a lot like the one that won 103 games last regular season, with more core players aging into their primes than aging out of them. Those Cubs beat their closest competitors by eight wins, and various win estimators — Pythagorean record, PythagenPat and Baseruns, third-order record — thought they were even better than that, with the underlying performance of a 107-to-113-win team.
The 2016 Cubs were good at everything: hitting, pitching, fielding, baserunning, inspirational speeches during rain delays. But they were best at preventing hits. Last year’s Cubs allowed a .255 batting average on balls in play, in a season when the league as a whole (Cubs included) averaged .298. The gap between the Cubs and the team with the second-best BABIP (the Blue Jays, at .282) was greater than the gap between Toronto and the 27th-place team. As FanGraphs’ Jeff Sullivan wrote last September, the Cubs’ BABIP allowed was last season’s “most extraordinary team statistic.”
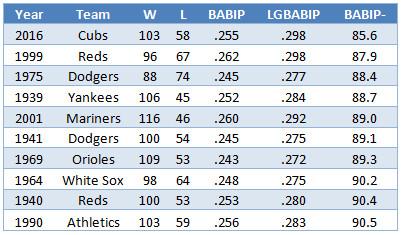
Actually, it was extraordinary by any season’s standards: Relative to the rest of the league, the Cubs were better at preventing hits than any team has ever been. The table below lists the best teams in non-strike seasons since 1901 by BABIP-, or team BABIP divided by league BABIP, multiplied by 100. (The lower the BABIP-, the better.)
To get some sense of how much this mattered, we can estimate how many more runs the Cubs would have allowed last year with a league-average BABIP. All it takes is a little arithmetic. Cubs pitchers, who limited contact, allowed 3,934 batted balls last year — the fewest of any team. Of those, 163 were home runs, which leaves 3,771 balls in play. Instead of 962 non-homer hits, the league-average Cubs would have allowed 1,124 hits — 162 additional hits, or exactly one more hit per game. If the difference between Triple-A Durham and Yankee Stadium is one hit a week, well, one hit a game really adds up.
If we assume that those extra hits would have had the same ratio of singles to doubles to triples that the Cubs really allowed, those 162 hits would break down into 125 singles, 34.5 doubles, and 2.5 triples. And if we plug in FanGraphs’ average run values for each of those hit types, relative to outs — for 2016, .724 runs for a single, 1.025 runs for a double, and 1.295 runs for a triple — we get an extra 129.1 runs allowed. The final step is converting runs to wins, at an exchange rate of 9.8 runs to a win. Our back-of-the-envelope answer: If the 2016 Cubs had simply allowed hits on balls in play at the same rate as the typical team, they would have won about 13 fewer games — 90, instead of 103.
And that’s a big part of the reason for the projections’ Cubs conservatism: The Cubs were so successful last season in part because they did something unprecedented, and the projections are betting that they can’t do it again.
Of course, the Cubs’ hit prevention wasn’t a complete fluke. Both DRS and UZR credited them with the best defenders in baseball. Their pitchers, led by premium pitch-tunneler Kyle Hendricks, seemed to suppress exit velocities and launch angles, yielding weaker contact. Their manager, Joe Maddon, made use of his multiposition players to keep fielders fresh. They used Statcast data to position their fielders efficiently, in some ways we’re aware of and, perhaps, in other ways we’re not. At least some of those skills should be repeatable.
On the other hand, betting on extreme outliers to repeat their performance tends to be bad business. Look at the seasonal leaders in any statistical category, and you’ll find that the same players tend to come back to the pack in the following year. In the Cubs’ case, we could point to some potential defensive downgrades: the outfield innings going to Schwarber and Jay; the loss of David Ross’s Jon Lester–saving back-picks; the aging and possible slowing of some of the returners from 2016. But we needn’t get granular to forecast some amount of regression. Maybe last year’s Cubs got a little lucky with their distribution of batted balls, or maybe they fielded for six months at a higher level than any other team has. Either way, it would be a stretch to expect them to keep it up for a second full season. We saw a drop last postseason when — admittedly, against better opponents — their BABIP allowed rose to .286, which was higher than the playoff average.
PECOTA calls for the Cubs’ BABIP allowed to be .286 in 2017, too. Steamer projects them at .293. Both projected rates rank among the best in baseball, but neither would be anywhere near where they were last year. Hence their expected gentle tumble from last season’s lofty perch.
So does a projected BABIP in the .290 range sound like a reasonable follow-up for a team that excelled like last year’s Cubs? In the wild-card era (excluding the strike-shortened 1994–95 seasons), the year-to-year correlation between a team’s BABIP- in one season and its BABIP- the next is .38, where zero would indicate no connection and 1 would mean a direct relationship. That’s a moderate-to-low correlation: A team that’s good at suppressing BABIP in one season tends to stay good the next season, but there’s plenty of room for fluctuations.
We can get a better sense of what to expect from the Cubs by looking at what happened to previous standout teams. This table lists the top 20 teams by BABIP-, excluding last year’s Cubs, strike-year teams, and teams from before 1920, when the schedule expanded to 154 games. The last two columns show each team’s BABIP and BABIP- in the following year.

Every team on the list saw its BABIP rise relative to the MLB baseline in the following year. Collectively, they surrendered about 56 percent of the difference between them and the league. If the Cubs stick to the pattern, their BABIP- will rise from 85.6 to 91.9, which in 2016 would have translated to .274 — which falls within the range that ranked as the most popular poll result when Sullivan crowdsourced the Cubs’ future BABIP last year. Running through the same calculation we performed earlier, a .274 BABIP would have cost the 2016 Cubs 71 hits, 57 runs, and roughly six wins. They still would have had the best record in baseball.
That .274 figure is a lot lower than what PECOTA and Steamer foresee, which might mean that the projections are a tad too pessimistic. Last year’s Cubs were incomparable at converting balls in play into outs, and this year’s edition won’t replicate their hit prevention. But if the past teams that came closest are a good guide, the Cubs will probably still stand out on defense — and they’ll probably still be the best team in baseball.
Thanks to Neil Weinberg of FanGraphs and Jared Cross of Steamer for research assistance.
Due to a production error, an earlier version of this post omitted the end of the story.