In the NFL, not every yard is equal, nor does every pass, rush, or pass rush have the same goal. However, traditional counting stats, like the ones you’ll find on NFL.com, treat all plays equally. Last year, the Cowboys snapped the ball every 29.95 seconds, while Chip Kelly’s Eagles led the league with a snap every 22.21 seconds. Should those two offenses be judged by the same sum-total stats? While these numbers can tell us what happened in a given game or across a season, counting stats often fail to tell us anything about the effectiveness of a player or a team.
That’s why Football Outsiders DVOA has become such a widely used statistic over the past decade: It takes into account various factors (quality of opponent, field position for an individual play, down and distance, and more) to tell us how efficient a team is. The Seahawks finished 20th in total passing yards in 2015, but that didn’t make them the 20th-best passing offense in the league. Instead, DVOA ranked them as the second-best pass offense. They didn’t pass as much as other teams, but when they did, good things happened.
Based on its personnel and its philosophy, each team in the NFL plays the game slightly differently, but traditional counting stats treat each team’s process as the same. Here are five stats that do a better job of telling us both how different teams and players play, and how good they are at whatever it is they do.
Big-Play Percentage
Tracking offensive big-play percentage — defined here as runs of more than 10 yards plus passes of more than 25 yards, divided by total plays — can give you a pretty good idea of just how aggressive a team is, and how effective it is at being aggressive. With this stat, it’s not about how many yards they get; it’s about how they get them.
“To score points consistently, you have to find a way to create big plays,” said then–Chargers head coach Norv Turner in 2010. “With all the things defenses do now like zone blitzes, multiple looks, multiple personnel, it’s harder to put together those 10-, 12-, 14-play drives.”
Getting a big play eliminates the need for that level of consistency and endurance. Everything else becomes less important if you’re picking up 50 yards in one play. It pays to play with chutzpah.
“Being able just to get one explosive play in a drive really increases your chances that you’re going to score points,” said Seahawks offensive coordinator Darrell Bevell last year. It’s an area that Seattle heavily emphasizes, as Pete Carroll’s early research into the subject showed that hitting an explosive run or pass play meant you’d score points on that possession more than 75 percent of the time. (Carroll defined “big plays” as more than 16 yards in the passing game and more than 12 yards in the running game.) That focus manifests itself in Seattle’s offense: It finished third in the NFL in big-play percentage in 2015, first in 2014, second in 2013, and third in 2012.
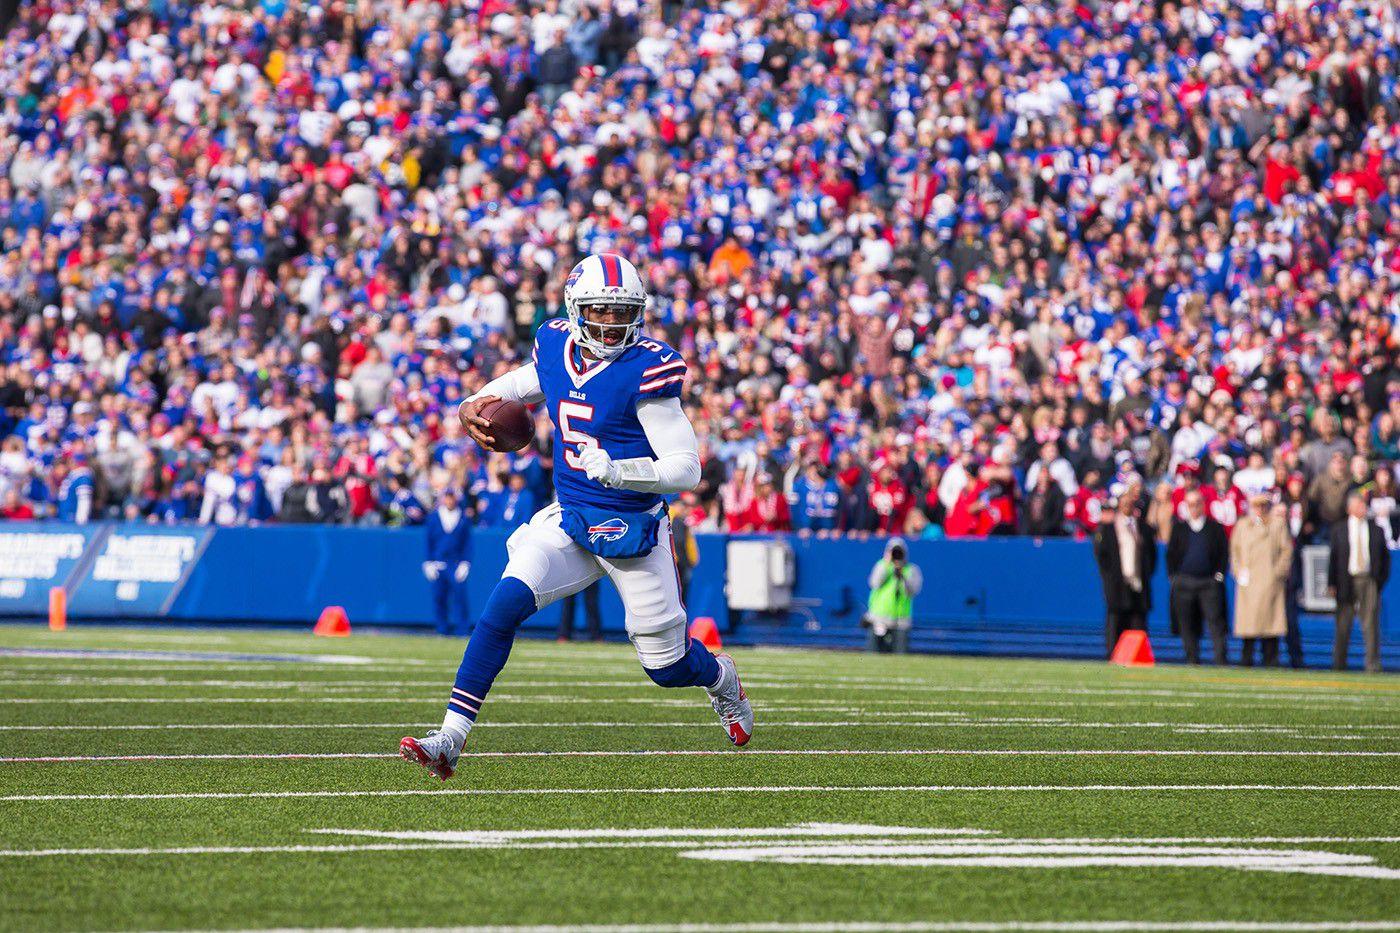
Unlike Seattle, the Bills’ offense probably doesn’t conjure up images of explosive plays, but their rushing offense helped them lead the way last year in big-play percentage, hitting one on 10 percent of their snaps. LeSean McCoy, Tyrod Taylor, and Karlos Williams were the home run hitters for Buffalo, which racked up 70 runs of 10-plus yards on the year, most in the NFL. The Vikings followed the same mold behind their franchise player and former MVP, Adrian Peterson, hitting a big play on 9.4 percent of their snaps. Turner’s new offense in Minnesota couldn’t create explosive plays in the passing game, so he made it a priority to do so in the run game. In addition to the Seahawks, the Panthers, Chiefs, and Steelers rounded out the top six in big-play percentage (the four of them coming at or very near to 9 percent).
Five of these six teams made the playoffs last year, and their explosive offenses were a big reason why.
Toxic Differential
If big-play percentage measures offensive aggression, toxic differential measures a team’s ability to balance risk and reward. This “synthesis of statistics” is championed by Super Bowl–winning coach Brian Billick, who recognized its importance based on values he learned from Bill Walsh. It combines turnover ratio (takeaways minus giveaways) plus big-play differential (big plays for minus big plays against), and it’s proved to be a pretty big predictor of success.
It’s not easy to stop big plays and take care of the football — both conservative ideals — while at the same time taking enough risks to create explosive plays and get takeaways. Toxic differential is a metric, according to Billick, that many coaches around the league track and a few prioritize, because while limiting turnovers on offense and big plays on defense has long been an emphasis, placing a stronger focus on creating big plays and getting turnovers is just as important. The best teams balance these priorities, and toxic differential does a good job of showing us which teams achieve that balance.
In 2015, the Panthers (plus-54 in toxic differential), Seahawks (plus-49), Bengals (plus-36), and Bills (plus-35) were the class of the NFL in this metric, with the Chiefs, Vikings, and Steelers rounding out the next tier. At the end of last season, 10 of the top 12 teams in toxic differential were headed to the playoffs.
Accuracy Percentage
Completion percentage just isn’t a comprehensive statistic. It includes incomplete passes that shouldn’t count against a quarterback — throwaways, spikes, and batted passes — and it docks them for the fluttering ducks they let loose when they’re hit as they’re throwing a pass.
Pro Football Focus’s accuracy percentage takes those plays out of the equation and adds in dropped passes as “completions,” all of which gives us a better idea of a quarterback’s accuracy. The quarterback is asked to get the football to his intended target, and this stat gives us a clearer picture of how often he does that.
Leaguewide, the best completion percentages approach but rarely exceed 70 percent, but top passers in accuracy percentage close in on 80 percent. 2015’s most accurate quarterback may surprise you: Vikings quarterback Teddy Bridgewater recorded an accuracy rate of 79.3 percent of his aimed passes to his targets, a full 14 points higher than his 65.3 percent standard completion rate. Sam Bradford (78.6 percent), Kirk Cousins (78.5 percent), Russell Wilson (78.4 percent), and Tom Brady (77.8 percent) rounded out the top five in that category. Now, obviously, if a quarterback is attempting shorter throws, his accuracy percentage is likely to be higher, and Bridgewater’s 7.23 yards per attempt (20th in the NFL) doesn’t paint a picture of a guy attacking downfield aggressively on lower-percentage throws.
That’s where PFF’s accuracy percentage splits come in. On deep passes (20 or more yards), Ben Roethlisberger was the NFL’s most accurate thrower, at 50.7 percent of those passes. Drew Brees (50.6), Russell Wilson (49.2), Cam Newton (47.9), and Andy Dalton (47.3) were close behind.
Running Back Success Rate
Football Outsiders’ running back success rate reveals more about the consistency of a rusher than yards per carry or total yards can. Like FO’s DVOA metric, running back success rate adds context to something like a 2-yard run. If that 2-yard gain comes on a third-and-1, it’s clearly a success, but that play hurts a player’s bottom line in terms of yards per carry. Success rate divides successful running plays by total running plays.
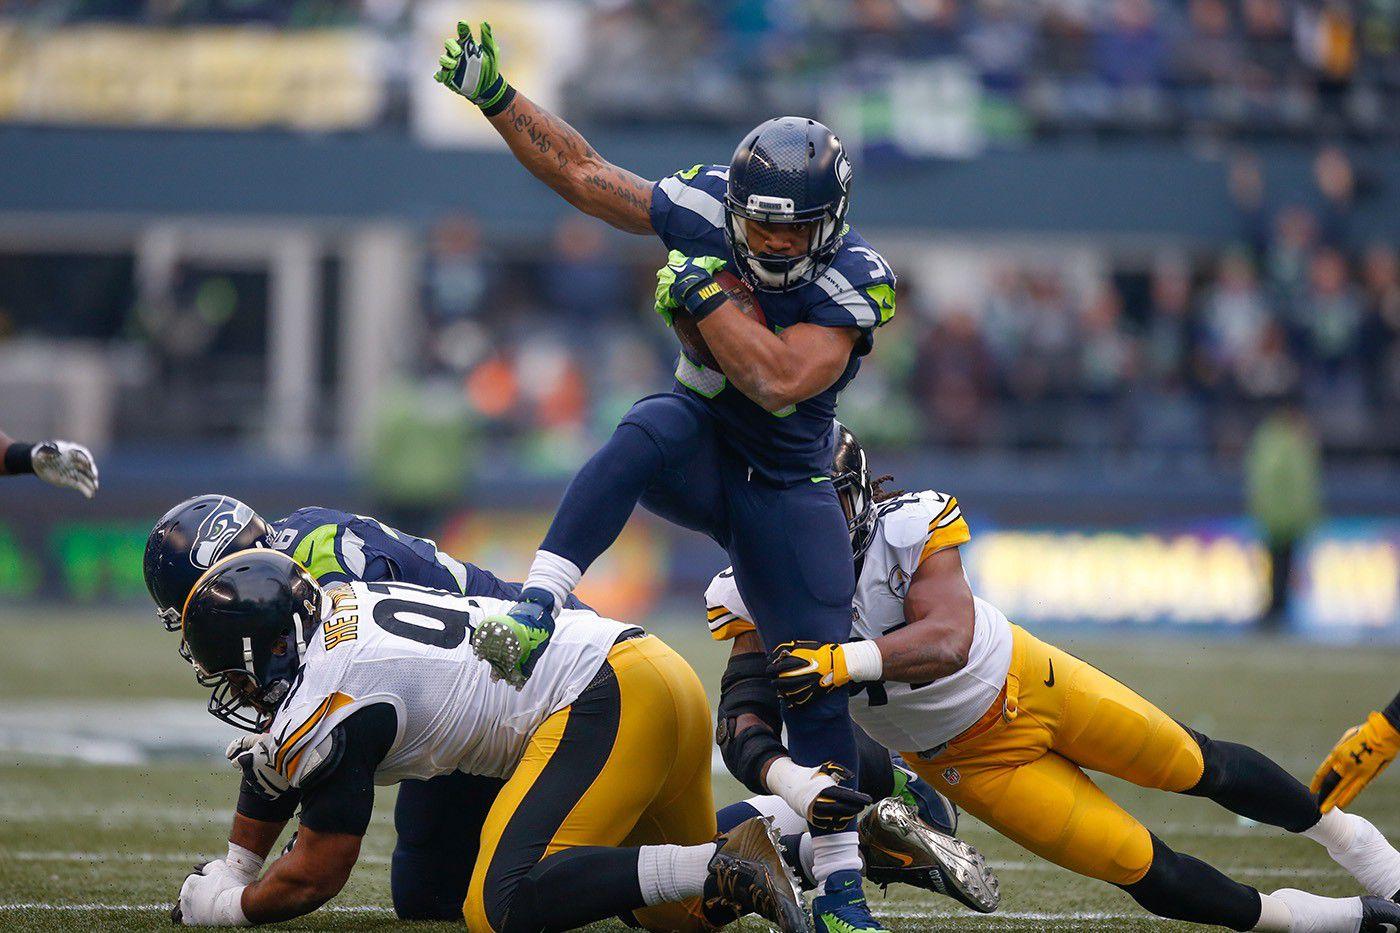
The Seahawks really liked their rookie running back out of Central Michigan, Thomas Rawls, but no one in that front office would’ve believed when they inked him in rookie free agency that he’d take over for an injured Marshawn Lynch and become the most consistent running back in the NFL last year per this metric, with 62 percent of his runs deemed successful.
Tampa Bay’s Charles Sims came in a close second to Rawls in success rate, at 57 percent, showing that while he averaged just 33 yards rushing per game and didn’t find the end zone, he might have been more effective as a runner than those numbers would suggest: When the Bucs called his number, he answered the bell at an excellent rate. Cardinals rookie David Johnson made waves in his first season by scoring six touchdowns (three rushing, two receiving, one returning) in his first five games, but while that pace certainly wasn’t sustainable, he produced consistently all year for Arizona, finishing with a 56 percent success rate on his rushes. The Giants’ Rashad Jennings quietly ranked fourth (56 percent), and Ryan Mathews had an underrated season in Philly as well, not only finishing third in DVOA (value per run), but also ending up fifth in success rate (53 percent).
Surprisingly, Rams rookie sensation Todd Gurley did not fare well here (36th in success rate), but when compared to his top-10 finish in DVOA, it suggests he was a boom-or-bust runner, mixing a lot of long, explosive runs with frequent stuffs at or behind the line of scrimmage.
On the other side of the spectrum were New England’s LeGarrette Blount (sixth in success rate, 20th in DVOA) and Dallas’s Darren McFadden (eighth in success rate, 23rd in DVOA), whose rankings suggest they got the necessary yards when they were asked to, but rarely provided much more.
Pass Rush Productivity
Sacks are sexy, but they don’t fully capture a player’s disruptiveness. How do you measure the effectiveness of a subpackage pass rush specialist who is asked to come in on third downs? That guy is getting about one-third of the snaps as normal three-down defensive linemen. How do you quantify the value of an interior rusher who makes a quarterback move off his spot with regularity? How do you credit a pass rusher for forcing a quarterback to panic and get rid of the ball in the face of certain obliteration?
Pro Football Focus’s pass rush productivity measures how effective pass rushers are, and while it includes sacks, which are given slightly more weight, it also adds in other impact plays like hits and hurries before dividing the total by pass rushing snaps. In other words: When an outside linebacker or defensive lineman is asked to get after the passer, this stat captures how often he’s affecting that quarterback’s ability to throw the ball.
The usual suspects tend to end up atop the pass rush productivity leaderboard — J.J. Watt, Ezekiel Ansah, and Khalil Mack are damn good no matter how you slice it — but it also highlights a few less-heralded producers.
For instance, if you’re in Chicago, there’s reason to be optimistic about what Pernell McPhee (6.0 sacks in 2015), Lamarr Houston (8.0 sacks), and Willie Young (6.5 sacks) can do in Vic Fangio’s scheme: McPhee was the top-rated 3–4 outside linebacker per pass rushing productivity, Young ranked 10th, and Houston 15th. These players won’t turn heads when it comes to overall sack numbers, but their efficiency should give Fangio plenty of options.
There’s reason for excitement in Atlanta, too. The Falcons recently signed veteran Dwight Freeney, whose eight sacks in 11 games last year certainly look appealing. But with Freeney’s late-career sack swoon — he had just 3.5 with the Chargers in 2014, which was his last full season — it’d be fair to wonder whether his 2015 performance was an outlier. Per pass rushing productivity, though, Freeney is still consistently producing with the best of them. He finished fourth among 3–4 outside linebackers in hurries in the 2014 season, then ranked second among all pass rushers in pass rushing productivity in 2015 when rushing from the right, which is exactly what he’ll do in Atlanta’s third-down subpackages this year.
Double-digit sack numbers from Freeney used to be an annual tradition, and his 16 in 2004 led the NFL, but those days are gone. He may be going into his 15th season, but he’s still hanging on because of the production he can provide on a limited snap count, an efficiency much better illustrated by something more than just a counting stat.
